

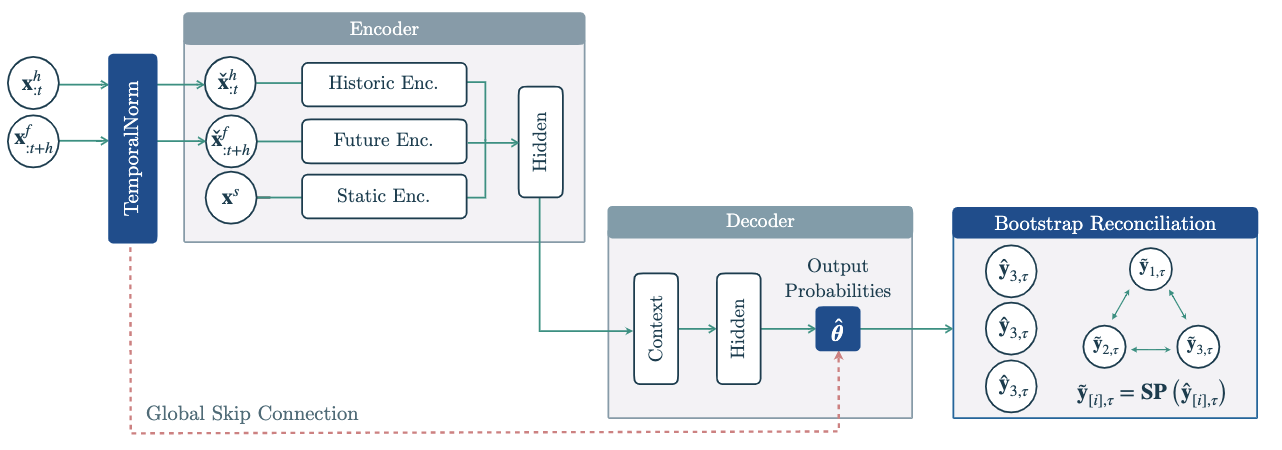
TemporalNorm module into any neural forecast
architecture, the module normalizes inputs into the network’s
non-linearities operating range and recomposes its output’s scales
through a global skip connection, improving accuracy and training
robustness. HINT ensures the forecast coherence via bootstrap sample
reconciliation that restores the aggregation constraints into its base
samples.
References
- Kin G. Olivares, David Luo, Cristian Challu, Stefania La Vattiata, Max Mergenthaler, Artur Dubrawski (2023). “HINT: Hierarchical Mixture Networks For Coherent Probabilistic Forecasting”. Neural Information Processing Systems, submitted. Working Paper version available at arxiv.
- Kin G. Olivares, O. Nganba Meetei, Ruijun Ma, Rohan Reddy, Mengfei Cao, Lee Dicker (2022).”Probabilistic Hierarchical Forecasting with Deep Poisson Mixtures”. International Journal Forecasting, accepted paper available at arxiv.
- Kin G. Olivares, Federico Garza, David Luo, Cristian Challu, Max Mergenthaler, Souhaib Ben Taieb, Shanika Wickramasuriya, and Artur Dubrawski (2022). “HierarchicalForecast: A reference framework for hierarchical forecasting in python”. Journal of Machine Learning Research, submitted, abs/2207.03517, 2022b.
1. HINT
HINT
TemporalNorm module into any neural forecast architecture,
the module normalizes inputs into the network’s non-linearities operating range
and recomposes its output’s scales through a global skip connection, improving
accuracy and training robustness. HINT ensures the forecast coherence via bootstrap
sample reconciliation that restores the aggregation constraints into its base samples.
- Identity
HINT.fit
TemporalNorm into the neural
forecast architecture for a scale-decoupled optimization that robustifies
cross-learning the hierachy’s series scales.
Parameters:
Returns:
HINT.predict
Returns:
Usage Example
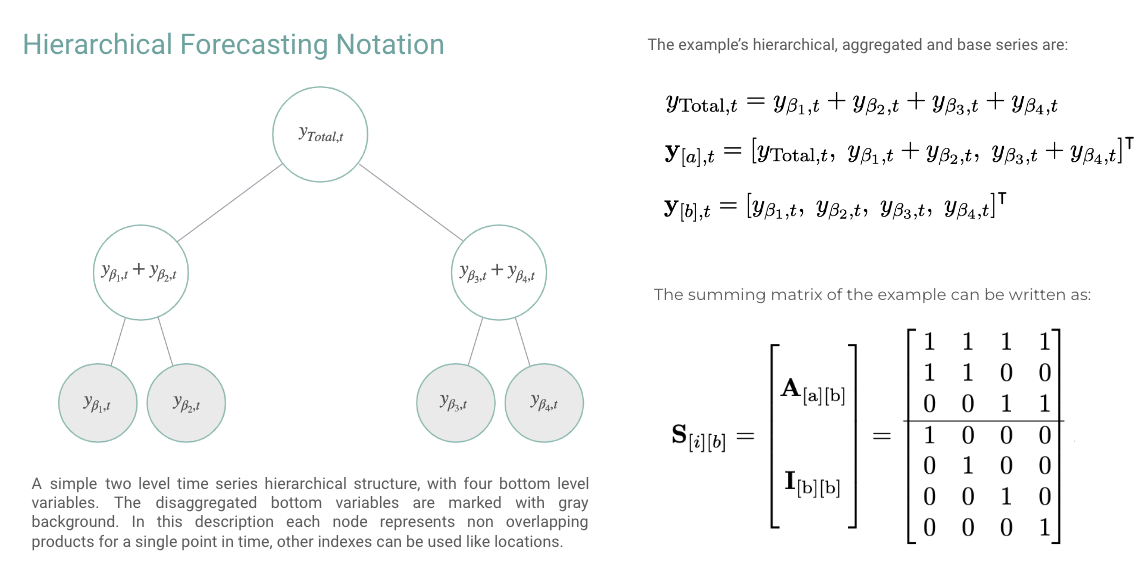
In this example we will use HINT for the hierarchical forecast task, a multivariate regression problem with aggregation constraints. The aggregation constraints can be compactcly represented by the summing matrix , the Figure belows shows an example. In this example we will make coherent predictions for the TourismL dataset. Outline:- Import packages
- Load hierarchical dataset
- Fit and Predict HINT
- Forecast Plot
2. Reconciliation Methods
get_identity_P
get_bottomup_P
Returns:
get_mintrace_ols_P
Returns:
get_mintrace_wls_P
Returns: