

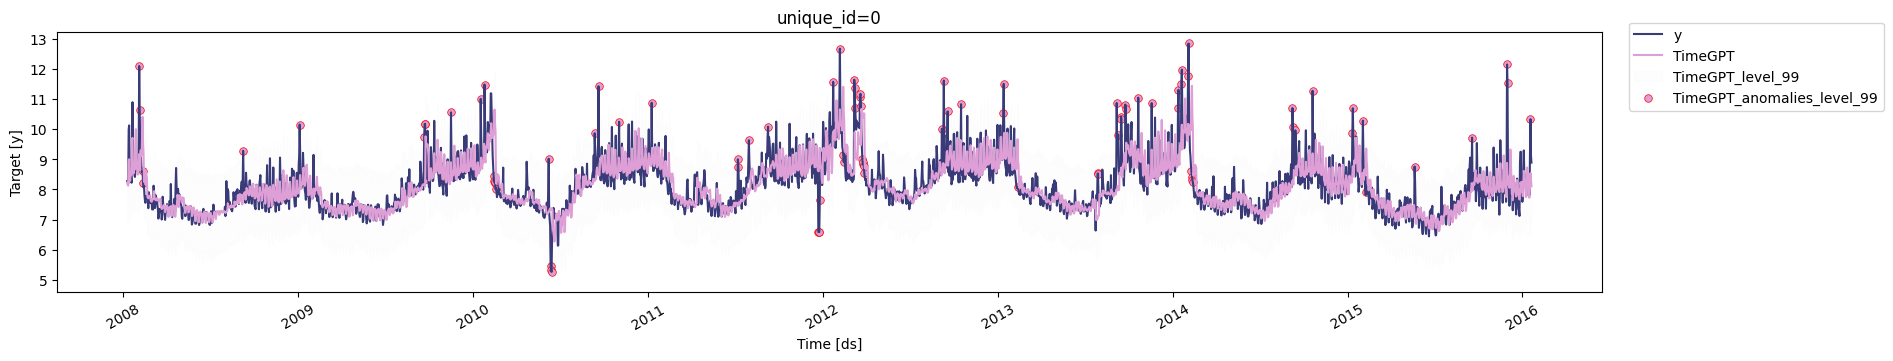
detect_anomalies
method. Then, plot the anomalies using the plot method.
👍 Use an Azure AI endpoint To use an Azure AI endpoint, set thebase_urlargument:nixtla_client = NixtlaClient(base_url="you azure ai endpoint", api_key="your api_key")
📘 Available models in Azure AI If you use an Azure AI endpoint, setFor an in-depth guide on historical anomaly detection with TimeGPT, check out our tutorial.model="azureai"nixtla_client.detect_anomalies(..., model="azureai")For the public API, two models are supported:timegpt-1andtimegpt-1-long-horizon. By default,timegpt-1is used. See this tutorial for details on usingtimegpt-1-long-horizon.