

👍 Use an Azure AI endpoint To use an Azure AI endpoint, set thebase_urlargument:nixtla_client = NixtlaClient(base_url="you azure ai endpoint", api_key="your api_key")
1. Dataset
In this notebook example from SMD dataset. SMD (Server Machine Dataset) is a benchmark dataset for anomaly detection with multiple time series. It monitors abnormal patterns in server machine data. Here, we use a set of monitoring data from a single server machine(machine-1-1) that has 38 time series. Each time series represents a different metric being monitored, such as CPU usage, memory usage, disk I/O, and network I/O.2. Univariate vs. Multivariate Method
2.1 Univariate Method
Univariate anomaly detection analyzes each time series independently, flagging anomalies based on deviations from its historical patterns. This method is effective for detecting issues within a single metric but ignores dependencies across multiple series. As a result, it may miss collective anomalies or flag irrelevant ones in scenarios where anomalies arise from patterns across multiple series, such as system-wide failures, correlated financial metrics, or interconnected processes. That’s when multivariate anomaly detection comes into play.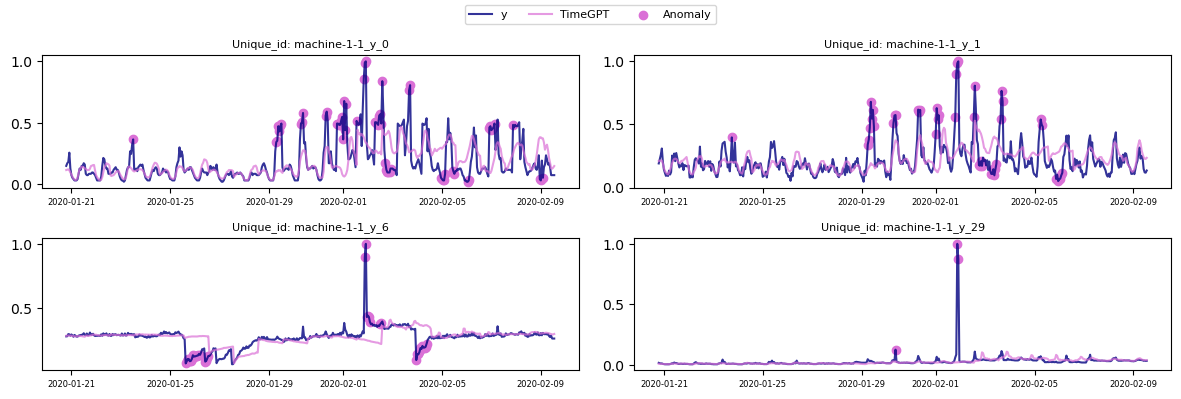
2.2 Multivariate Method
The multivariate anomaly detection method considers multiple time series simultaneously. Instead of treating each series in isolation, it accumulates the anomaly scores for the same time step across all series and determines whether the step is anomalous based on the combined score. This method is particularly useful in scenarios where anomalies are only significant when multiple series collectively indicate an issue. To apply multivariate detection, simply set thethreshold_method parameter to multivariate.
We can see that the anomalies detected for each time series occur at the
same time step since they rely on the accumulated error across all
series.
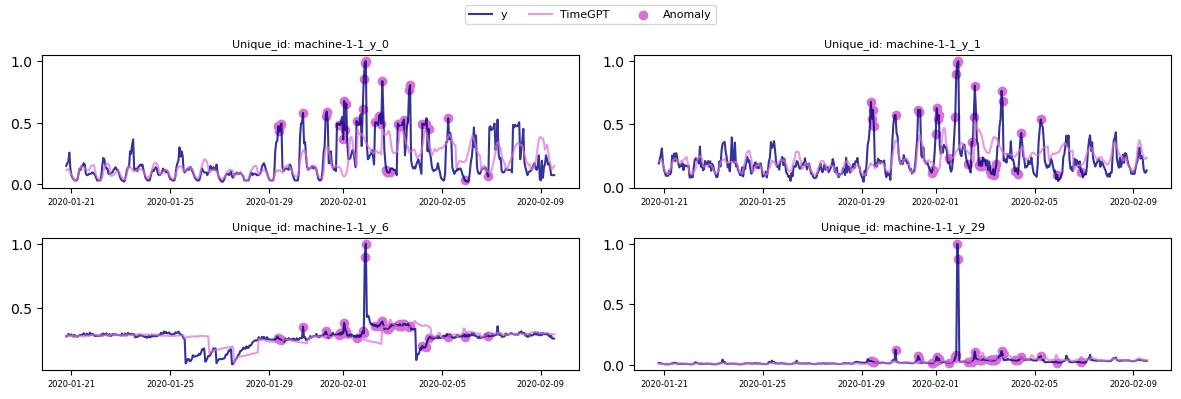
📘 In multiseries anomaly detection, error scores from all time series are aggregated at each time step, and a threshold is applied to identify significant deviations. If the aggregated error exceeds the threshold, the time step is flagged as anomalous across all series, capturing system-wide patterns.