

conformalforecast represents it, what
it guarantees, and where it will stop you.
Left-NaN padding
ASeries array is always (n_series, T). Short series are padded with
NaN on the left, so every series ends on the same column and column
T-1 means “most recent” for all of them.
That convention is enforced. An interior gap or a trailing NaN is an
error, because either would silently break the “last column is now”
invariant that every method relies on.
long_to_panel returns the matrix and a PanelIndex that remembers how
to undo the pivot: the series ids, each series’ length, its offset into
the matrix, and the timestamps. panel_to_long uses it to go back,
dropping the padding.
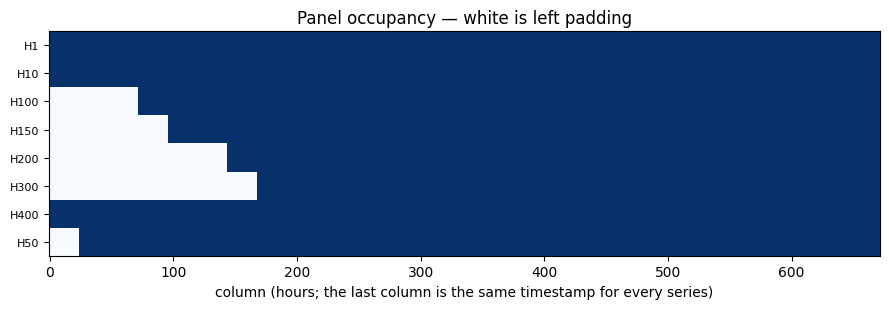
Methods propagate NaN, they never impute
A NaN in a calibration array means “this window does not exist for this series”. A method carries that through scoring and takes per-(series, horizon) quantiles with NaN-aware order statistics, so a
short series is calibrated on its own windows and nobody else’s.
The consequence you can see is n_calibration_samples_ on the fitted
object: an effective count per series, not the number you asked for.
The floor, and the error you get
Every series needs at leastceil(1 / alpha) effective windows. Below
that the requested quantile is not attainable from the sample at all,
and fit refuses rather than returning something that looks like an
interval.
series_indices is the point of the exception: on a 500-series panel
you need to know which ones are short, not merely that something was.
ceil(1/alpha)is arithmetic, not a heuristic The conformal quantile is thek = ceil((1 - alpha)(n + 1))-th order statistic. For that index to exist at all you needn >= 1/alpha - 1; below it the interval would have to be unbounded. The package rounds that up to then >= ceil(1/alpha)the error message quotes, soalpha = 0.01genuinely requires 100 windows. Loweringalphais not free.
Dense windows vs calendar-aligned cutoffs
calibrate_cv has an aligned flag, and it decides what axis 1 of the
calibration arrays means.
aligned=False(the default) — dense per-series windows. Windowkis “k steps before this series’ own end”. Every series contributes the same number of windows, and no NaN is introduced.aligned=True— calendar-aligned cutoffs. Windowkis the same wall-clock cutoff for every series, and a series that did not exist yet gets a NaN cell.
aligned=True
produces the NaN cells that the dense mode would have quietly filled
with a different series’ history.
Nixtla cross-validation has its own length requirementWhich is easy enough to show, since nothing about a retired series is exotic. Truncate one series’ tail and the two modes stop agreeing.alignedis aconformalforecastconcept, but the windows come from the underlying library. statsforecast raisesValueError: The following series are too short for the cross validation settingsbefore either mode is reached if any series cannot supplyn_windowscutoffs. Assemble the arrays yourself — withpanel.cv_frames_to_arrays, in the panel API reference — if you need windows the library will not give you.
n_calibration_samples_ is 10 either way. The difference is
the axis they sit on.
statsforecast counts cutoffs back from each series’ own end date, so
the retired series’ ten cutoffs are 48 hours earlier than everyone
else’s and share nothing with them. Dense mode says “window k is k
steps before this series’ end” and returns a compact array. Aligned mode
has to put every distinct cutoff on the calendar axis, so it returns a
wider, mostly-NaN cube: each series occupies only the columns it
actually reached.
Aligned mode is not free on a panel with many distinct end dates The calendar axis is the union of every series’ cutoffs. When end dates are spread out, that union grows with the number of series rather than withn_windows, and the cube grows with it. Worse, axis 1 stops meaning “chronological age”, which is exactly what NexCP and SPCI read it as. Prefer the defaultaligned=Falseunless you specifically need calendar comparability.
Per-series diagnostics
The real payoff of keeping series separate is that you can ask where the interval is failing.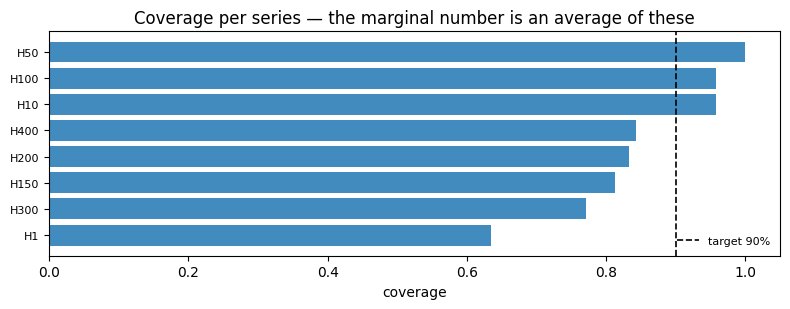
H1 at 63.5% with H50 at 100%, and five of the eight series sit below
the 90% target. The headline names none of them — which is why
coverage_by_series exists, and why the per-series calibration this
page describes is worth its complexity.
Next
- NexCP — the method that reads the window axis as time.
- Diagnostics — the rest of the per-slice measurements.
- Architecture — the shape conventions in full.