

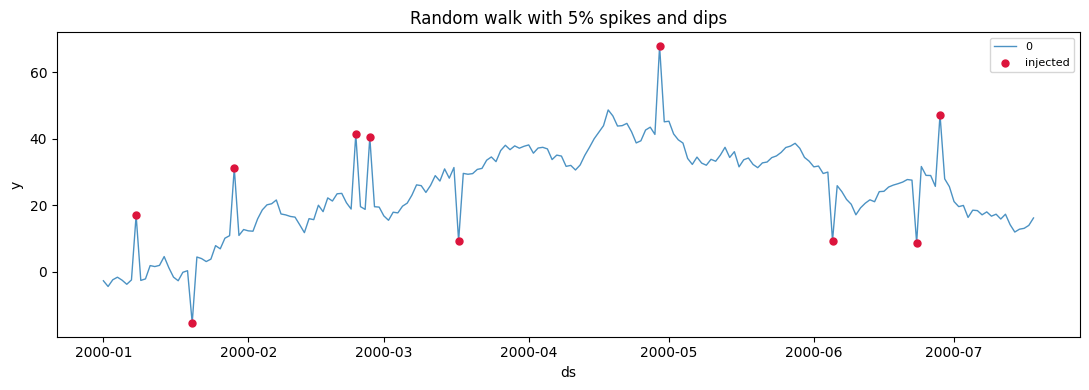
Ground-truth labels Setexogenous=ExogenousConfig(anomaly_flags=True)and the output gains ananomaly_flagcolumn marking every injected point. That turns a synthetic series into a labelled benchmark for detection methods. The plots below use it to highlight the injected anomalies in red.
Point anomalies: spikes and dips
Spikes and dips are single-point outliers.anomaly_fraction sets how
many points are affected; spike_magnitude and dip_magnitude set
their size (in the series’ own units).
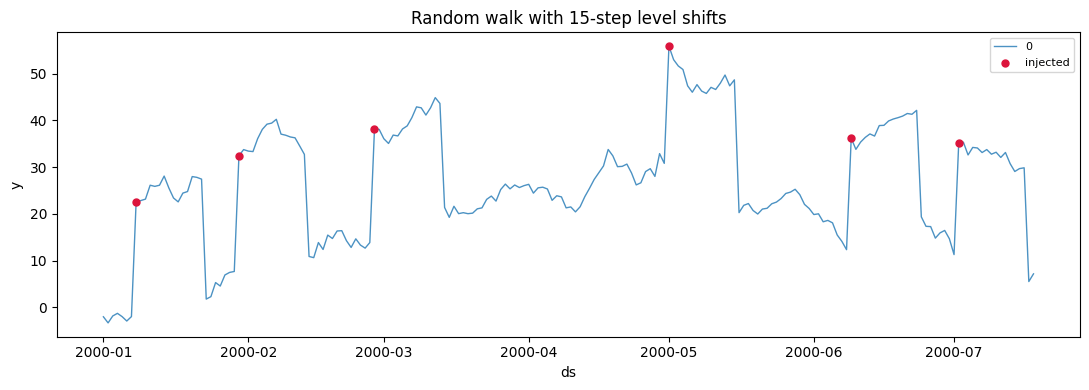
Level shifts
A level shift is a sustained jump: the series steps to a new level and stays there forlevel_shift_duration steps. These are harder for
models than isolated spikes because they look like a regime change.
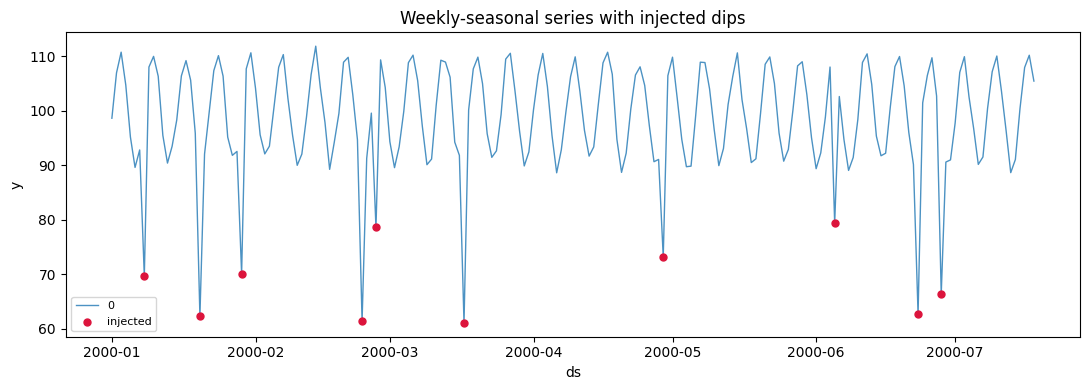
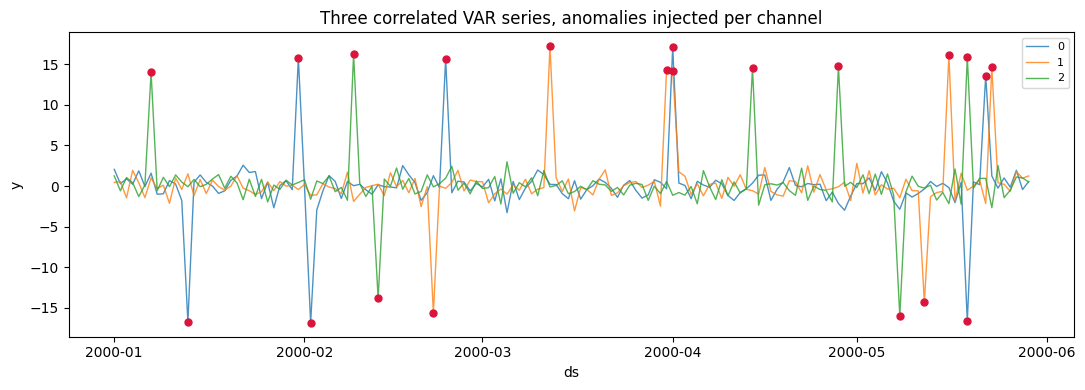
On any generator, including multivariate
Anomaly injection is part of the shared generator pipeline, so it works the same on a seasonal series or a multivariateVAR, where each
channel is perturbed independently.
Combine with missing data
Anomalies and missing values compose, so you can build a realistically messy series in one call — outliers to detect and gaps to impute.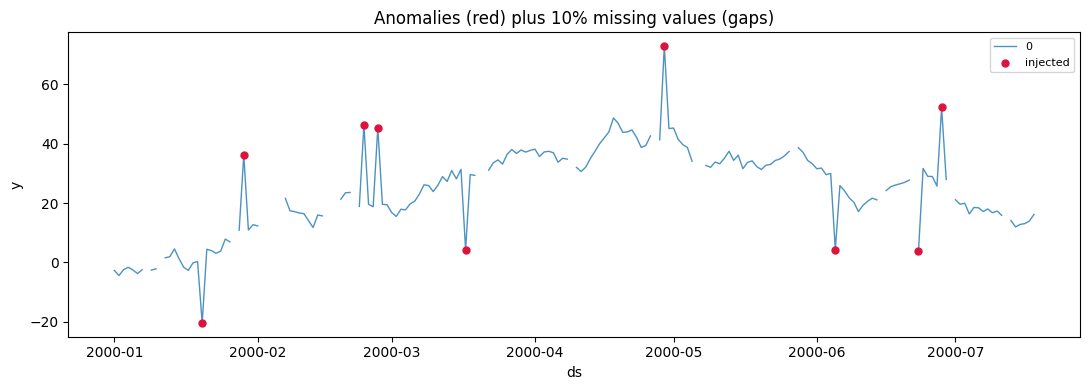
Related capabilities
- Changepoints — structural breaks in level, trend, or variance (a modelled regime change rather than an anomaly).
- Missingness — random, block, and seasonal gap patterns.
- The magnitudes and durations here are the common knobs; every anomaly parameter is listed in the generator reference.