

SeasonalGenerator builds one by
adding a periodic wave, a linear trend, and observation noise, which
makes it the natural test of whether a model captures periodicity and
extrapolates the level.
The model
seasonality_period— length of one cycle in time steps (24 gives a daily cycle on hourly data).seasonality_amplitude— height of the seasonal swing.trend— linear drift per step;base_level— the starting level.noise_level— standard deviation of the additive noise.
Define generator parameters
Configure a seasonal generator with daily seasonality (24-hour period), a slight upward trend, and a base level of 50.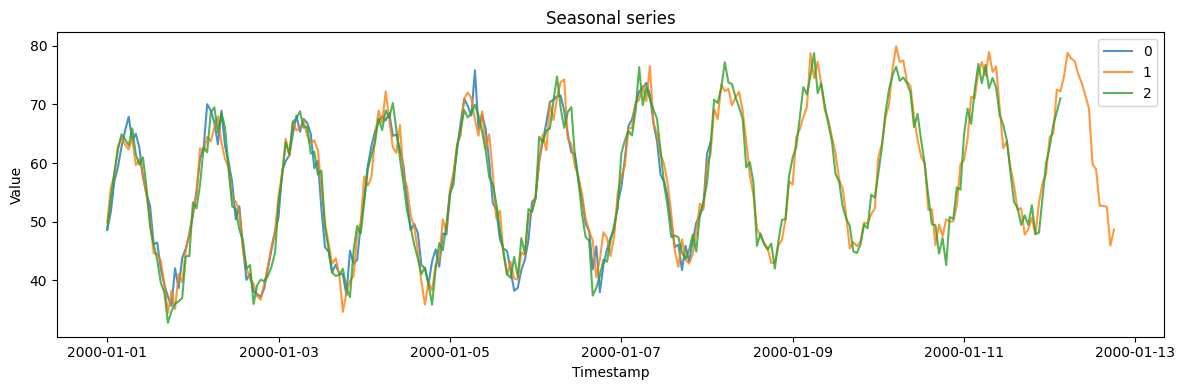
min_length ≠ max_length) but
share the same daily shape and trend — the seasonal structure a
forecaster should learn.
Inspect the generated data
Statistics by series
Sample of one series
View the first 24 hours of a single series to see the seasonal pattern.Related generators
- SARIMA — seasonality with autoregressive/moving-average dynamics instead of a fixed wave.
- ETS — seasonality through exponential-smoothing state-space models.
- Layer on anomalies or changepoints to stress-test a seasonal model.