plot_series
plot_series(df=None, forecasts_df=None, ids=None, plot_random=True, max_ids=8, models=None, level=None, max_insample_length=None, plot_anomalies=False, engine='matplotlib', palette=None, id_col='unique_id', time_col='ds', target_col='y', seed=0, resampler_kwargs=None, ax=None)
| Name | Type | Description | Default |
|---|---|---|---|
df | pandas or polars DataFrame | DataFrame with columns [id_col, time_col, target_col]. Defaults to None. | None |
forecasts_df | pandas or polars DataFrame | DataFrame with columns [id_col, time_col] and models. Defaults to None. | None |
ids | list of str | Time Series to plot. If None, time series are selected randomly. Defaults to None. | None |
plot_random | bool | Select time series to plot randomly. Defaults to True. | True |
max_ids | int | Maximum number of ids to plot. Defaults to 8. | 8 |
models | list of str | Models to plot. Defaults to None. | None |
level | list of float | Prediction intervals to plot. Defaults to None. | None |
max_insample_length | int | Maximum number of train/insample observations to be plotted. Defaults to None. | None |
plot_anomalies | bool | Plot anomalies for each prediction interval. Defaults to False. | False |
engine | str | Library used to plot. ‘plotly’, ‘plotly-resampler’ or ‘matplotlib’. Defaults to ‘matplotlib’. | ‘matplotlib’ |
palette | str | Name of the matplotlib colormap to use for the plots. If None, uses the current style. Defaults to None. | None |
id_col | str | Column that identifies each serie. Defaults to ‘unique_id’. | ‘unique_id’ |
time_col | str | Column that identifies each timestep, its values can be timestamps or integers. Defaults to ‘ds’. | ‘ds’ |
target_col | str | Column that contains the target. Defaults to ‘y’. | ‘y’ |
seed | int | Seed used for the random number generator. Only used if plot_random is True. Defaults to 0. | 0 |
resampler_kwargs | dict | Keyword arguments to be passed to plotly-resampler constructor. For further custumization (“show_dash”) call the method, store the plotting object and add the extra arguments to its show_dash method. Defaults to None. | None |
ax | matplotlib axes, array of matplotlib axes or plotly Figure | Object where plots will be added. Defaults to None. | None |
| Type | Description |
|---|---|
| matplotlib or plotly figure: Plot’s figure |
from utilsforecast.data import generate_series
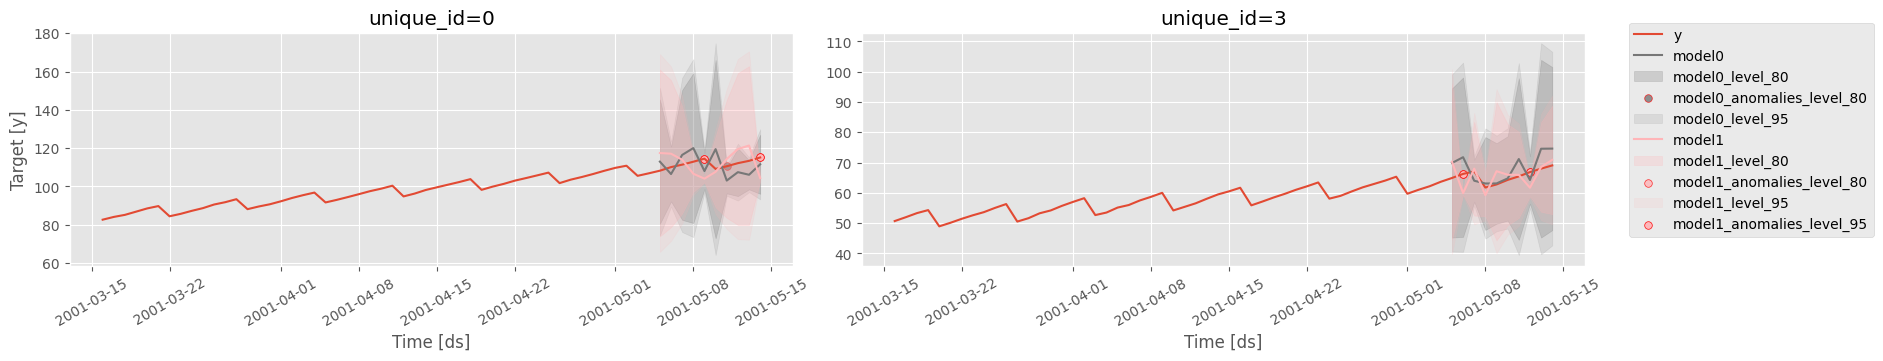
level = [80, 95]
series = generate_series(4, freq='D', equal_ends=True, with_trend=True, n_models=2, level=level)
test_pd = series.groupby('unique_id', observed=True).tail(10).copy()
train_pd = series.drop(test_pd.index)
plt.style.use('ggplot')
fig = plot_series(
    train_pd,
    forecasts_df=test_pd,
    ids=[0, 3],
    plot_random=False,
    level=level,
    max_insample_length=50,
    engine='matplotlib',
    plot_anomalies=True,
)
fig.savefig('imgs/plotting.png', bbox_inches='tight')