

SynAugment and shows
what the augmentation actually guarantees.
SynAugment fits a generator to each input series, draws new series
from it, and then rescales every synthetic draw to the source series’
mean, standard deviation, and lag-1 autocorrelation. Those
three statistics therefore match by construction — reporting them back
as “close to the original” would only measure the rescaling step, not
the quality of the augmentation.
So instead of a fidelity table dominated by matched-by-design
statistics, this page reports two things the rescaling does not
determine:
- Whether the synthetic series are new draws rather than near-copies. We check the correlation between each synthetic series and its source.
- How the unpinned properties behave — the distribution shape (min, max, skewness), which is free to vary and shows how much the synthetic draws explore around the target moments.
datasetsforecast (pip install datasetsforecast)
M4 hourly data
Load hourly time series from the M4 competition and analyze their patterns before augmenting.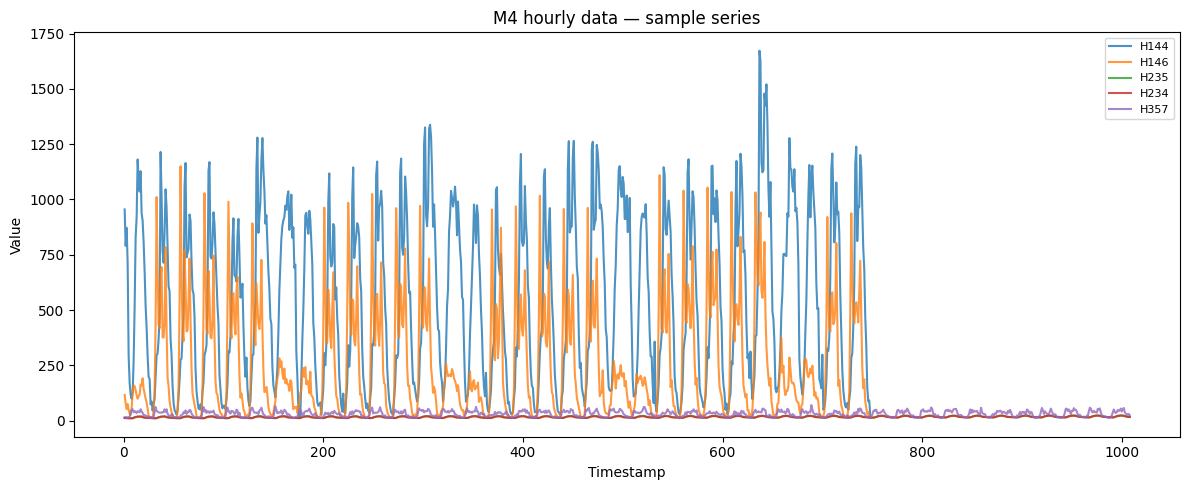
Analyzing series patterns
SynAugment detects seasonality, trend, and stationarity to choose the best generator for each series.Augmenting the data
Generate 3 synthetic series per original series.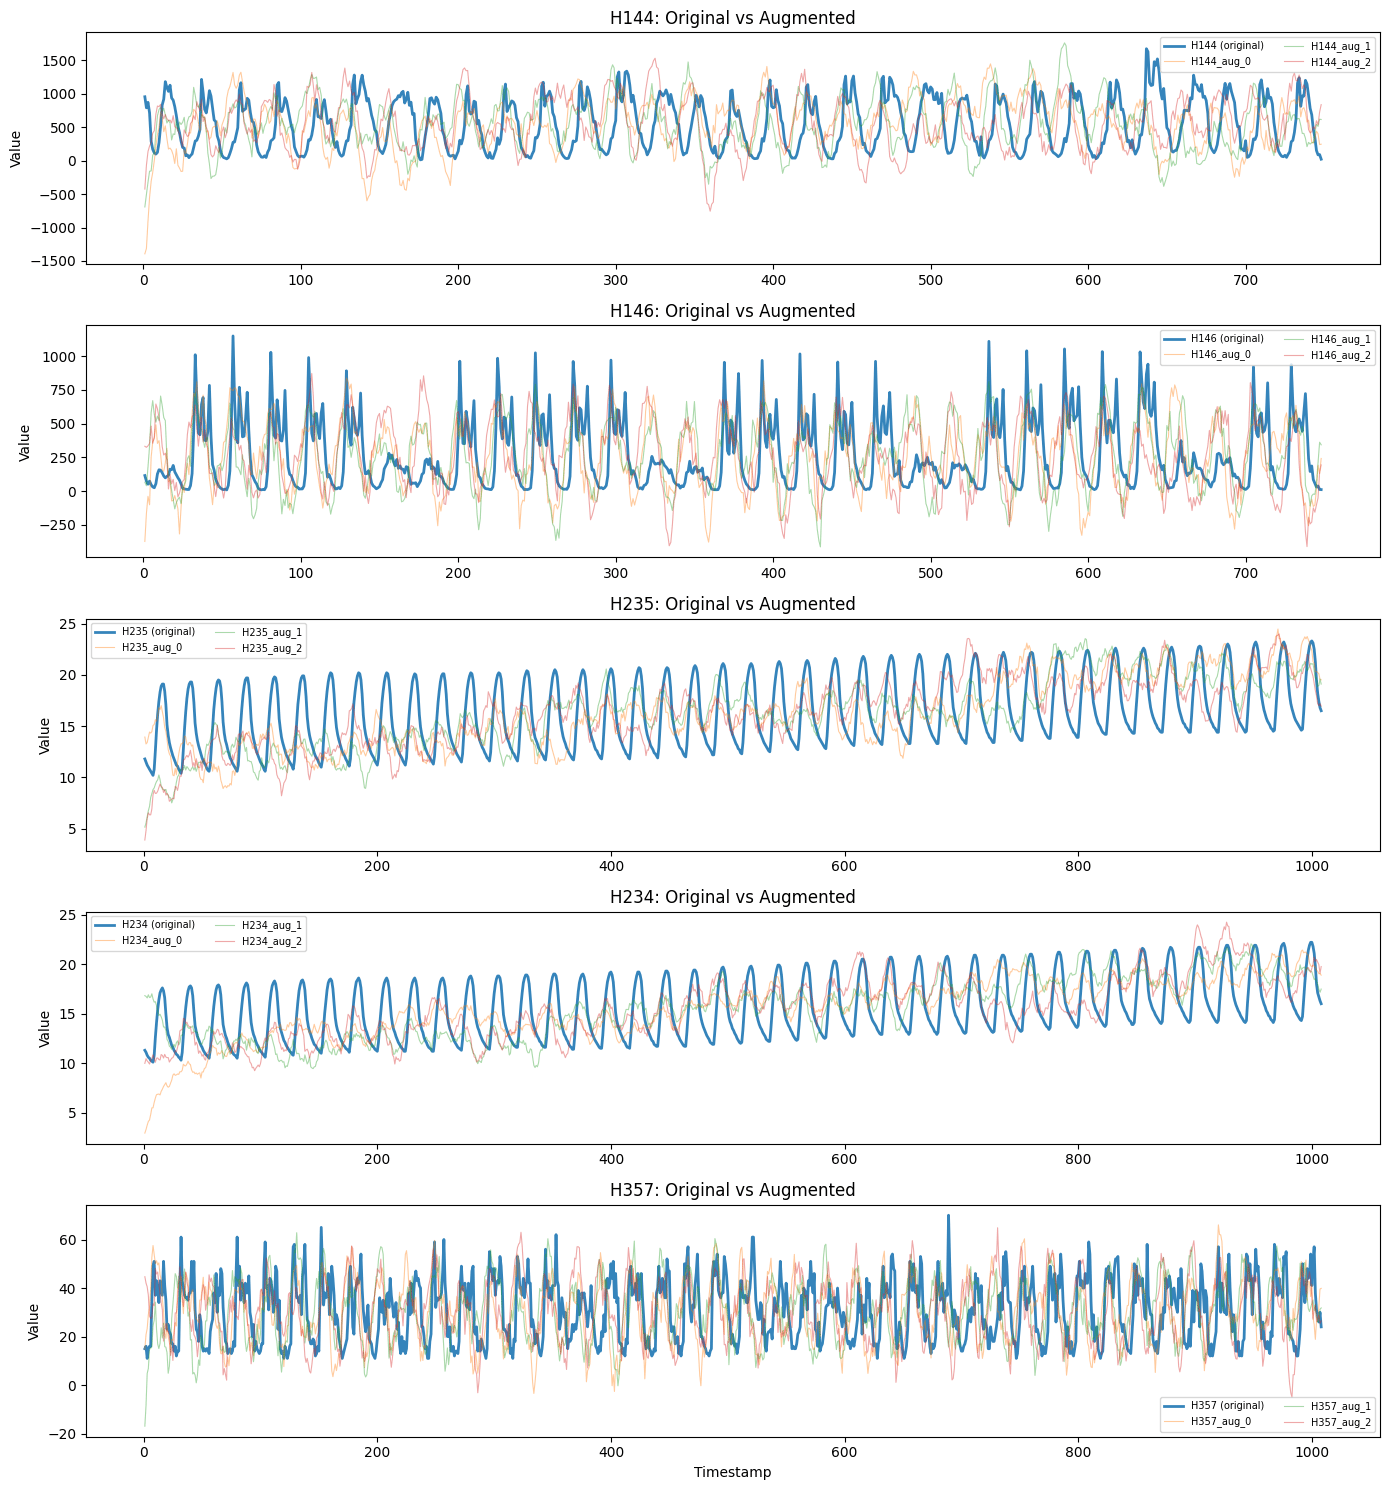
What augmentation pins, and what it leaves free
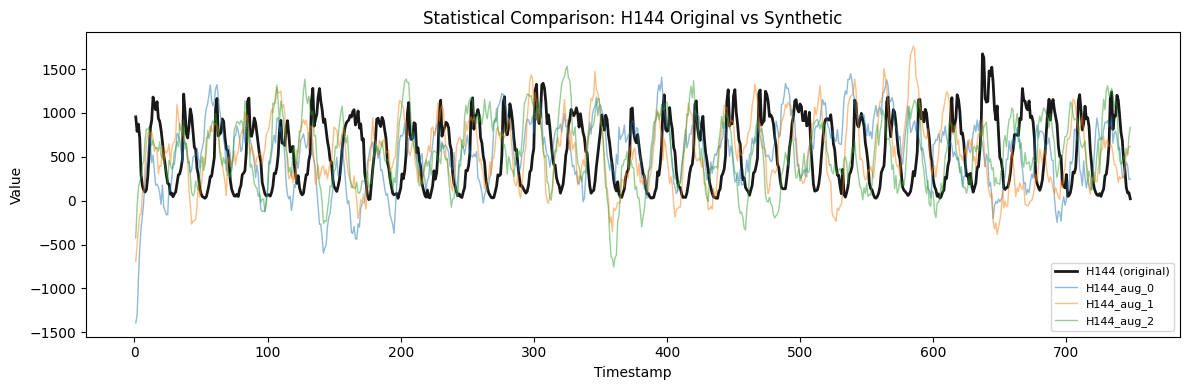
For one series, we compare the original statistics against the average across its synthetic draws. Themean, std, cv, and autocorr_lag1
rows are pinned by construction — expect them near 0% and read nothing
into it. The min, max, range, and skewness rows are free to vary
and show how the synthetic draws differ in shape.
We also report the correlation between each synthetic draw and the
source series. Low correlations are the point here: they show the draws
are genuinely new series that happen to share the pinned summary
statistics, not rescaled copies of the input.
M4 daily data
Augment daily frequency data from the M4 competition.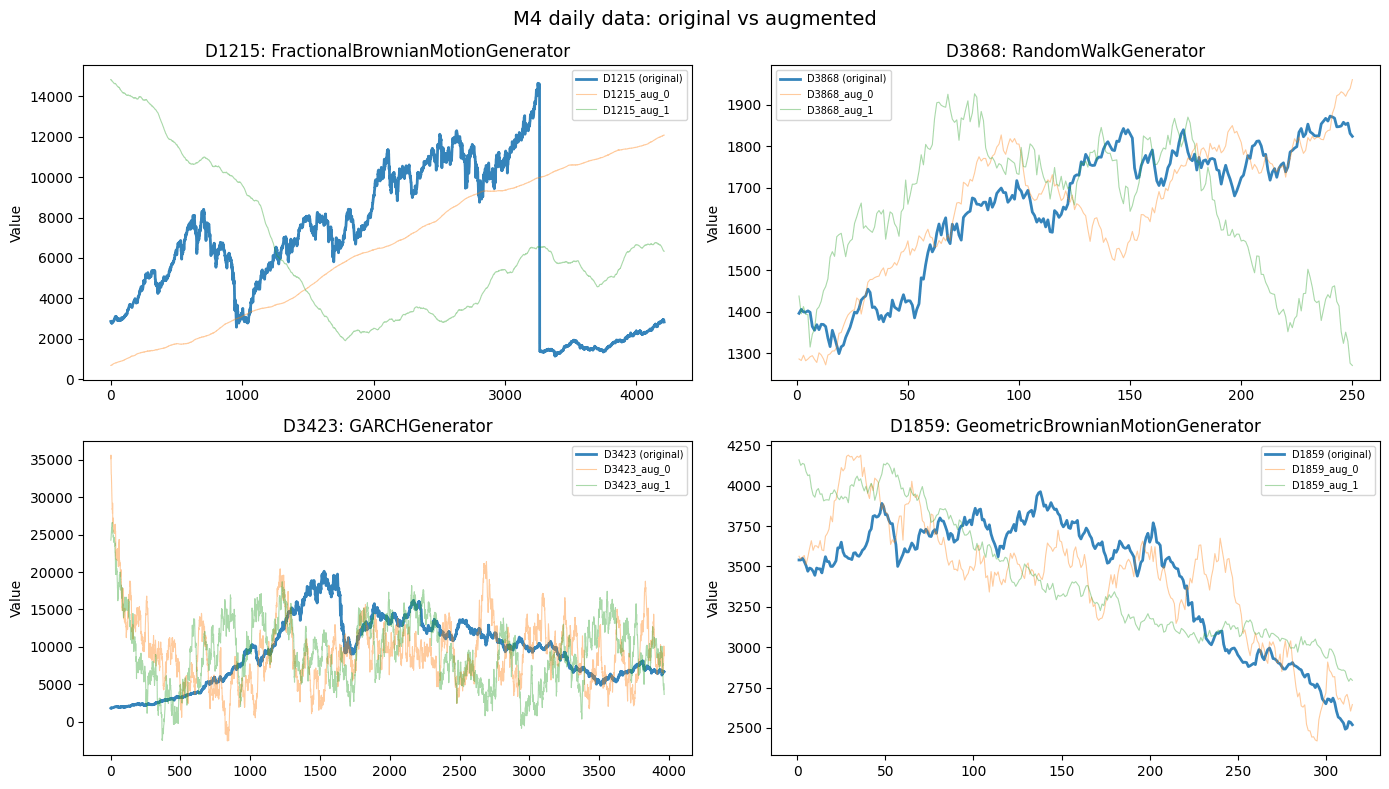
Cross-series statistics
Because every synthetic series is pinned to its source’s mean and std, the panel-level averages of those statistics line up almost exactly. That confirms the pinning holds across the whole panel — it is not emergent fidelity. In the histograms the synthetic means and stds stack on the same locations as the originals (three synthetic draws per source), while the lag-1 autocorrelation, which is only approximately targeted, shows a little more spread.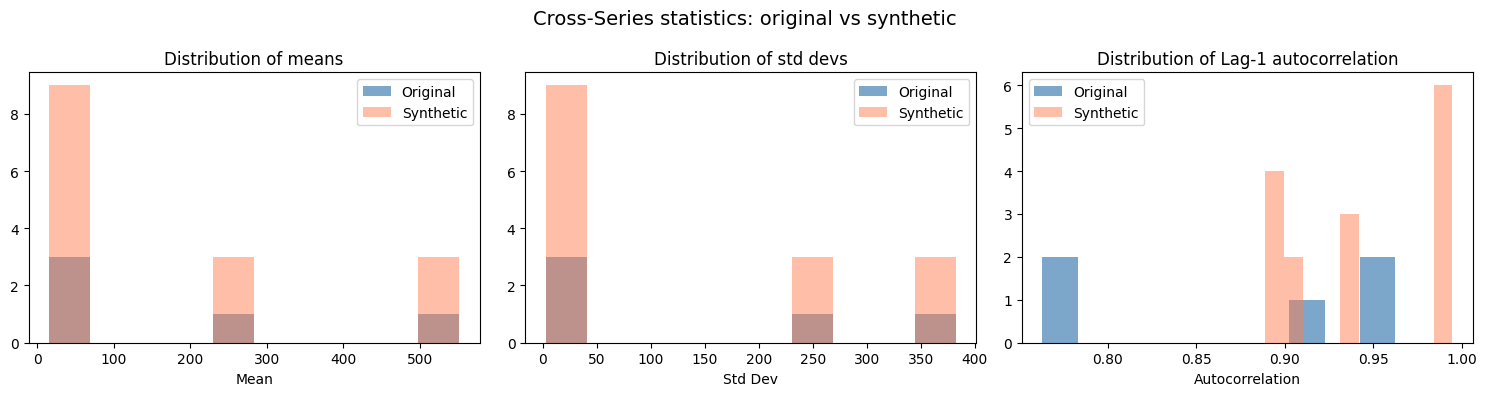
Augmenting for ML training
A common use case: expand a small dataset to create a larger training set for ML models.A non-duplication check
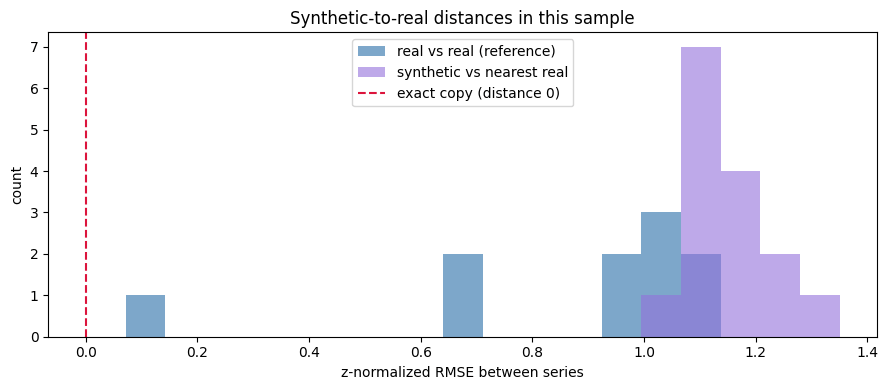
Before using an augmented panel, a basic sanity check is whether its synthetic draws are near-copies of the source series.SynAugment pins
each synthetic series to its source’s summary statistics but draws the
series fresh. The check below measures non-duplication only; it is not a
privacy test.
To check, we z-normalize every series (dropping the pinned mean and std
so we compare shape, not level) and measure how far each synthetic
series is from its nearest real series. The distances between the real
series themselves give the reference scale.
What this is, and is not
This is only an empirical non-duplication check under z-normalized
RMSE. It does not establish resistance to reconstruction, membership
inference, attribute inference, or other privacy attacks. SynAugment
provides no differential-privacy guarantee or epsilon bound. For
sensitive or regulated data, use a dedicated disclosure-risk
assessment and appropriate privacy controls.
Summary
SynAugmentguarantees the mean, standard deviation, and lag-1 autocorrelation of each synthetic series by rescaling it to its source. Treat those matches as a property of the method, not as a validation result.- The synthetic series are new draws rather than copies: their trajectories decorrelate from the source, and their distribution shape (min, max, skewness) varies freely around the pinned moments.
- Use augmentation to expand a small panel with series that share the summary statistics of the originals. Fit augmentation parameters on the training split only, and choose the augmentation ratio on validation data — never on the final holdout.
- Before sharing, run non-duplication and domain-specific disclosure-risk checks. This example’s distance test is a sanity check, not evidence of privacy.