> ## Documentation Index
> Fetch the complete documentation index at: https://nixtlaverse.nixtla.io/llms.txt
> Use this file to discover all available pages before exploring further.
> Forecasting utilities
# utilsforecast
## Install
### PyPI
```sh theme={null}
pip install utilsforecast
```
### Conda
```sh theme={null}
conda install -c conda-forge utilsforecast
```
***
## How to use
### Generate synthetic data
```python theme={null}
from utilsforecast.data import generate_series
series = generate_series(3, with_trend=True, static_as_categorical=False)
series
```
```
| | unique_id | ds | y |
|-----|-----------|------------|------------|
| 0 | 0 | 2000-01-01 | 0.422133 |
| 1 | 0 | 2000-01-02 | 1.501407 |
| 2 | 0 | 2000-01-03 | 2.568495 |
| 3 | 0 | 2000-01-04 | 3.529085 |
| 4 | 0 | 2000-01-05 | 4.481929 |
| ... | ... | ... | ... |
| 481 | 2 | 2000-06-11 | 163.914625 |
| 482 | 2 | 2000-06-12 | 166.018479 |
| 483 | 2 | 2000-06-13 | 160.839176 |
| 484 | 2 | 2000-06-14 | 162.679603 |
| 485 | 2 | 2000-06-15 | 165.089288 |
```
***
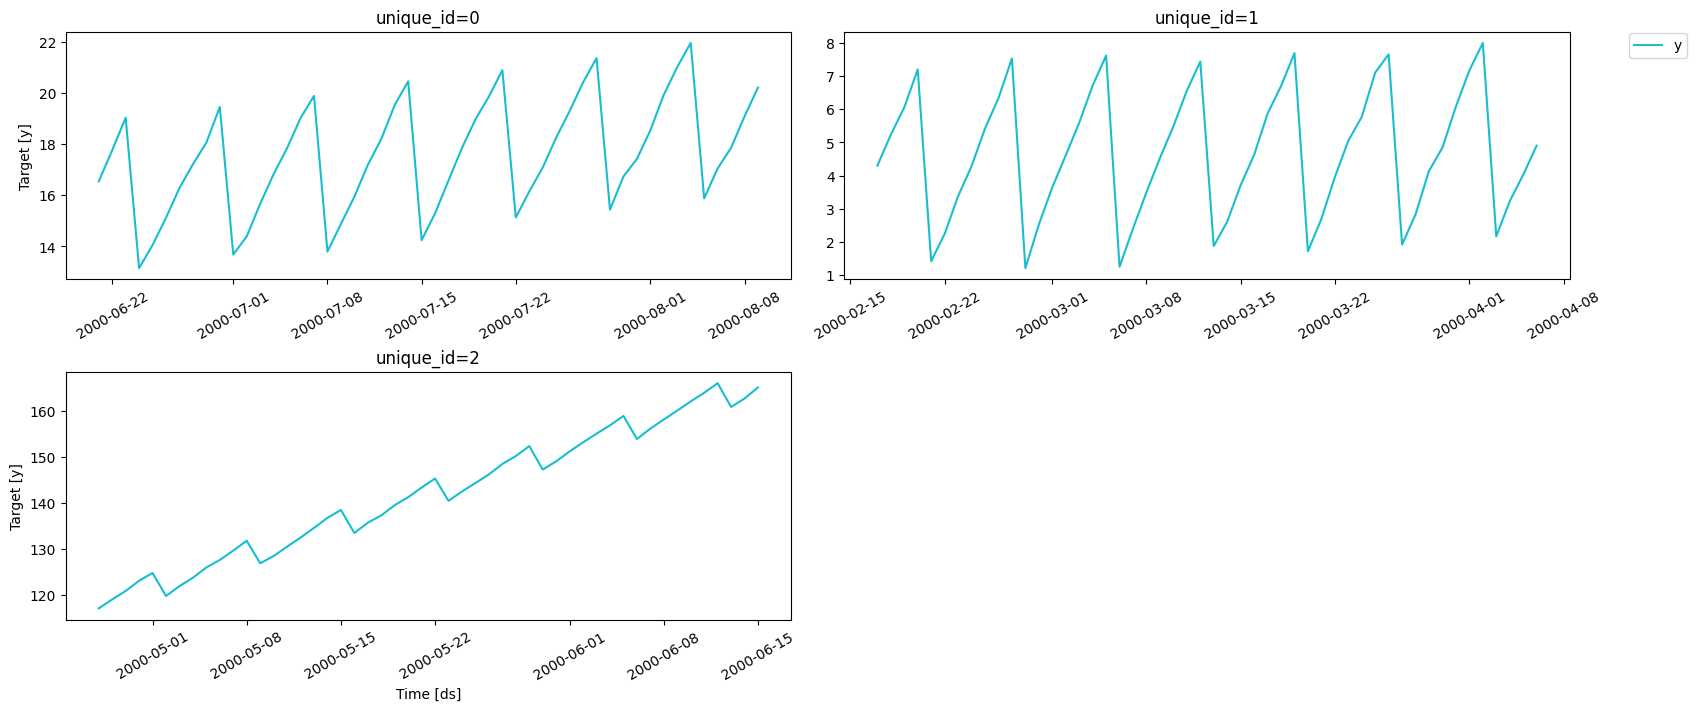
### Plotting
```python theme={null}
from utilsforecast.plotting import plot_series
fig = plot_series(series, plot_random=False, max_insample_length=50, engine='matplotlib')
fig.savefig('imgs/index.png', bbox_inches='tight')
```

 ***
### Preprocessing
```python theme={null}
from utilsforecast.preprocessing import fill_gaps
serie = series[series['unique_id'].eq(0)].tail(10)
# drop some points
with_gaps = serie.sample(frac=0.5, random_state=0).sort_values('ds')
with_gaps
```
Example output with missing dates:
```
| | unique_id | ds | y |
|-----|-----------|------------|-----------|
| 213 | 0 | 2000-08-01 | 18.543147 |
| 214 | 0 | 2000-08-02 | 19.941764 |
| 216 | 0 | 2000-08-04 | 21.968733 |
| 220 | 0 | 2000-08-08 | 19.091509 |
| 221 | 0 | 2000-08-09 | 20.220739 |
```
```python theme={null}
fill_gaps(with_gaps, freq='D')
```
Returns:
```
| | unique_id | ds | y |
|-----|-----------|------------|-----------|
| 0 | 0 | 2000-08-01 | 18.543147 |
| 1 | 0 | 2000-08-02 | 19.941764 |
| 2 | 0 | 2000-08-03 | NaN |
| 3 | 0 | 2000-08-04 | 21.968733 |
| 4 | 0 | 2000-08-05 | NaN |
| 5 | 0 | 2000-08-06 | NaN |
| 6 | 0 | 2000-08-07 | NaN |
| 7 | 0 | 2000-08-08 | 19.091509 |
| 8 | 0 | 2000-08-09 | 20.220739 |
```
***
### Evaluating
```python theme={null}
from functools import partial
import numpy as np
from utilsforecast.evaluation import evaluate
from utilsforecast.losses import mape, mase
```
```python theme={null}
valid = series.groupby('unique_id').tail(7).copy()
train = series.drop(valid.index)
rng = np.random.RandomState(0)
valid['seas_naive'] = train.groupby('unique_id')['y'].tail(7).values
valid['rand_model'] = valid['y'] * rng.rand(valid['y'].shape[0])
daily_mase = partial(mase, seasonality=7)
evaluate(valid, metrics=[mape, daily_mase], train_df=train)
```
```
| | unique_id | metric | seas_naive | rand_model |
|-----|-----------|--------|------------|------------|
| 0 | 0 | mape | 0.024139 | 0.440173 |
| 1 | 1 | mape | 0.054259 | 0.278123 |
| 2 | 2 | mape | 0.042642 | 0.480316 |
| 3 | 0 | mase | 0.907149 | 16.418014 |
| 4 | 1 | mase | 0.991635 | 6.404254 |
| 5 | 2 | mase | 1.013596 | 11.365040 |
```
***
***
### Preprocessing
```python theme={null}
from utilsforecast.preprocessing import fill_gaps
serie = series[series['unique_id'].eq(0)].tail(10)
# drop some points
with_gaps = serie.sample(frac=0.5, random_state=0).sort_values('ds')
with_gaps
```
Example output with missing dates:
```
| | unique_id | ds | y |
|-----|-----------|------------|-----------|
| 213 | 0 | 2000-08-01 | 18.543147 |
| 214 | 0 | 2000-08-02 | 19.941764 |
| 216 | 0 | 2000-08-04 | 21.968733 |
| 220 | 0 | 2000-08-08 | 19.091509 |
| 221 | 0 | 2000-08-09 | 20.220739 |
```
```python theme={null}
fill_gaps(with_gaps, freq='D')
```
Returns:
```
| | unique_id | ds | y |
|-----|-----------|------------|-----------|
| 0 | 0 | 2000-08-01 | 18.543147 |
| 1 | 0 | 2000-08-02 | 19.941764 |
| 2 | 0 | 2000-08-03 | NaN |
| 3 | 0 | 2000-08-04 | 21.968733 |
| 4 | 0 | 2000-08-05 | NaN |
| 5 | 0 | 2000-08-06 | NaN |
| 6 | 0 | 2000-08-07 | NaN |
| 7 | 0 | 2000-08-08 | 19.091509 |
| 8 | 0 | 2000-08-09 | 20.220739 |
```
***
### Evaluating
```python theme={null}
from functools import partial
import numpy as np
from utilsforecast.evaluation import evaluate
from utilsforecast.losses import mape, mase
```
```python theme={null}
valid = series.groupby('unique_id').tail(7).copy()
train = series.drop(valid.index)
rng = np.random.RandomState(0)
valid['seas_naive'] = train.groupby('unique_id')['y'].tail(7).values
valid['rand_model'] = valid['y'] * rng.rand(valid['y'].shape[0])
daily_mase = partial(mase, seasonality=7)
evaluate(valid, metrics=[mape, daily_mase], train_df=train)
```
```
| | unique_id | metric | seas_naive | rand_model |
|-----|-----------|--------|------------|------------|
| 0 | 0 | mape | 0.024139 | 0.440173 |
| 1 | 1 | mape | 0.054259 | 0.278123 |
| 2 | 2 | mape | 0.042642 | 0.480316 |
| 3 | 0 | mase | 0.907149 | 16.418014 |
| 4 | 1 | mase | 0.991635 | 6.404254 |
| 5 | 2 | mase | 1.013596 | 11.365040 |
```
***