> ## Documentation Index
> Fetch the complete documentation index at: https://nixtlaverse.nixtla.io/llms.txt
> Use this file to discover all available pages before exploring further.
# Quick start
SynForecast generates synthetic time-series panels — validated,
reproducible, and in the same long format as the rest of the
Nixtlaverse. This guide goes from a one-line panel to explicitly
controlled generators, injected real-world patterns, and mixed datasets.
> **Common uses**
>
> * **Testing** a forecasting pipeline on data whose true process you
> know, before trusting it on real series.
> * **Augmenting** a small panel so a global model has more to learn
> from — see [SynAugment](../capabilities/augmentation).
> * **Pretraining** foundation models on a diverse corpus no single
> real dataset provides.
> * **Sharing** a reproducible example without exposing proprietary
> data.
## 1. Generate a panel in one line
`generate_series` draws from a balanced pool of generators spanning
trends, seasonality, volatility clustering, counts, and more, then
returns a panel you can hand straight to any Nixtla forecaster.
```python theme={null}
from synforecast import generate_series
panel = generate_series(
n_series=6,
freq="D",
min_length=200,
max_length=200,
engine="polars",
seed=1,
)
panel.head()
```
| unique\_id | ds | y |
| ---------- | ------------------- | --------- |
| cat | datetime\[ns] | f64 |
| "0" | 2000-01-01 00:00:00 | 0.705375 |
| "0" | 2000-01-02 00:00:00 | 0.838695 |
| "0" | 2000-01-03 00:00:00 | 0.303755 |
| "0" | 2000-01-04 00:00:00 | -0.502002 |
| "0" | 2000-01-05 00:00:00 | 0.060002 |
> **The Nixtla long format**
>
> Every SynForecast output uses three columns — `unique_id` (series id),
> `ds` (timestamp), and `y` (value) — the schema `statsforecast`,
> `mlforecast`, and `neuralforecast` all expect, so no adapter is
> needed. The default `engine="pandas"` returns a pandas frame; pass
> `engine="polars"` (as here) for Polars.
```python theme={null}
import matplotlib.pyplot as plt
import polars as pl
from utilsforecast.plotting import plot_series
def plot_panel(df, title, max_series=8):
"""Overlay a panel on one axis, for series that share a data-generating process."""
fig, ax = plt.subplots(figsize=(11, 4))
for uid in df["unique_id"].unique(maintain_order=True).to_list()[:max_series]:
series = df.filter(pl.col("unique_id") == uid)
ax.plot(series["ds"], series["y"], linewidth=1, alpha=0.8, label=str(uid))
ax.set(title=title, xlabel="ds", ylabel="y")
ax.legend(fontsize=8, ncol=4)
plt.tight_layout()
plt.show()
# These six series come from six different generators, so their scales differ by
# an order of magnitude. One panel per series keeps the small-amplitude
# processes readable; `plot_panel` above is for series that share a process.
plot_series(panel, max_ids=6, plot_random=False)
```
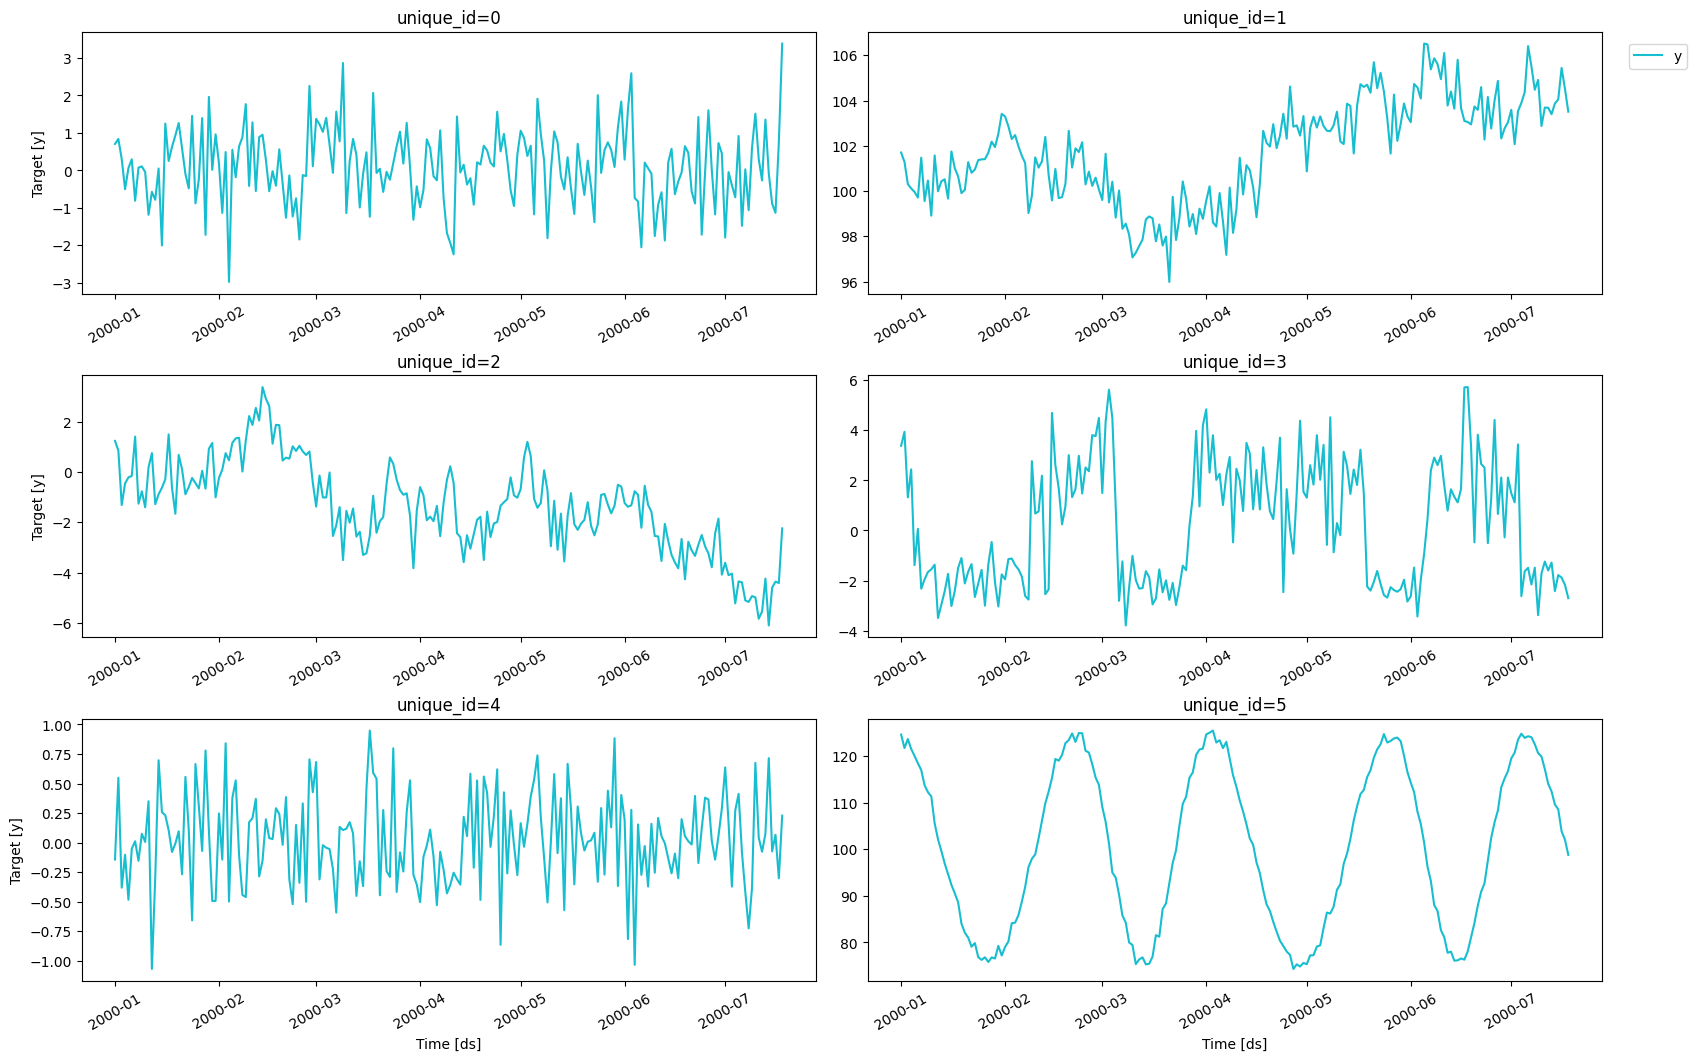 Each line is a different data-generating process. Together they cover
ARIMA dynamics, exponential smoothing, long memory, regime switching,
volatility clustering, and irregular cycles. That diversity is what
turns the panel into a stress test for a forecaster rather than one
shape repeated six times.
Don’t take that on trust — pass `with_generator_col=True` to record
which generator produced each series:
```python theme={null}
provenance = generate_series(
n_series=6,
freq="D",
min_length=200,
max_length=200,
engine="polars",
seed=1,
with_generator_col=True,
)
per_series = provenance.group_by("unique_id", "generator").len().sort("unique_id")
print(per_series)
assert per_series["generator"].n_unique() == 6, "panel should span 6 generators"
```
```text theme={null}
shape: (6, 3)
┌───────────┬─────────────────────────────────┬─────┐
│ unique_id ┆ generator ┆ len │
│ --- ┆ --- ┆ --- │
│ cat ┆ str ┆ u32 │
╞═══════════╪═════════════════════════════════╪═════╡
│ 0 ┆ SARIMAGenerator ┆ 200 │
│ 1 ┆ ETSGenerator ┆ 200 │
│ 2 ┆ FractionalBrownianMotionGenera… ┆ 200 │
│ 3 ┆ RegimeSwitchingGenerator ┆ 200 │
│ 4 ┆ GARCHGenerator ┆ 200 │
│ 5 ┆ CyclicGenerator ┆ 200 │
└───────────┴─────────────────────────────────┴─────┘
```
## 2. Choose a generator when you need control
`generate_series` is the fast default. When you need a known process —
for example, to confirm your model recovers an upward trend —
instantiate a generator and set its parameters explicitly. Here, a
random walk with positive drift and moderate volatility.
```python theme={null}
from synforecast.generators import RandomWalkGenerator
rw = RandomWalkGenerator(
engine="polars",
min_length=200,
max_length=200,
freq="D",
drift=0.1,
volatility=1.5,
start_value=100.0,
seed=42,
)
walks = rw.generate(n_series=4)
plot_panel(walks, "Random walks with positive drift (drift=0.1, volatility=1.5)")
```
Each line is a different data-generating process. Together they cover
ARIMA dynamics, exponential smoothing, long memory, regime switching,
volatility clustering, and irregular cycles. That diversity is what
turns the panel into a stress test for a forecaster rather than one
shape repeated six times.
Don’t take that on trust — pass `with_generator_col=True` to record
which generator produced each series:
```python theme={null}
provenance = generate_series(
n_series=6,
freq="D",
min_length=200,
max_length=200,
engine="polars",
seed=1,
with_generator_col=True,
)
per_series = provenance.group_by("unique_id", "generator").len().sort("unique_id")
print(per_series)
assert per_series["generator"].n_unique() == 6, "panel should span 6 generators"
```
```text theme={null}
shape: (6, 3)
┌───────────┬─────────────────────────────────┬─────┐
│ unique_id ┆ generator ┆ len │
│ --- ┆ --- ┆ --- │
│ cat ┆ str ┆ u32 │
╞═══════════╪═════════════════════════════════╪═════╡
│ 0 ┆ SARIMAGenerator ┆ 200 │
│ 1 ┆ ETSGenerator ┆ 200 │
│ 2 ┆ FractionalBrownianMotionGenera… ┆ 200 │
│ 3 ┆ RegimeSwitchingGenerator ┆ 200 │
│ 4 ┆ GARCHGenerator ┆ 200 │
│ 5 ┆ CyclicGenerator ┆ 200 │
└───────────┴─────────────────────────────────┴─────┘
```
## 2. Choose a generator when you need control
`generate_series` is the fast default. When you need a known process —
for example, to confirm your model recovers an upward trend —
instantiate a generator and set its parameters explicitly. Here, a
random walk with positive drift and moderate volatility.
```python theme={null}
from synforecast.generators import RandomWalkGenerator
rw = RandomWalkGenerator(
engine="polars",
min_length=200,
max_length=200,
freq="D",
drift=0.1,
volatility=1.5,
start_value=100.0,
seed=42,
)
walks = rw.generate(n_series=4)
plot_panel(walks, "Random walks with positive drift (drift=0.1, volatility=1.5)")
```
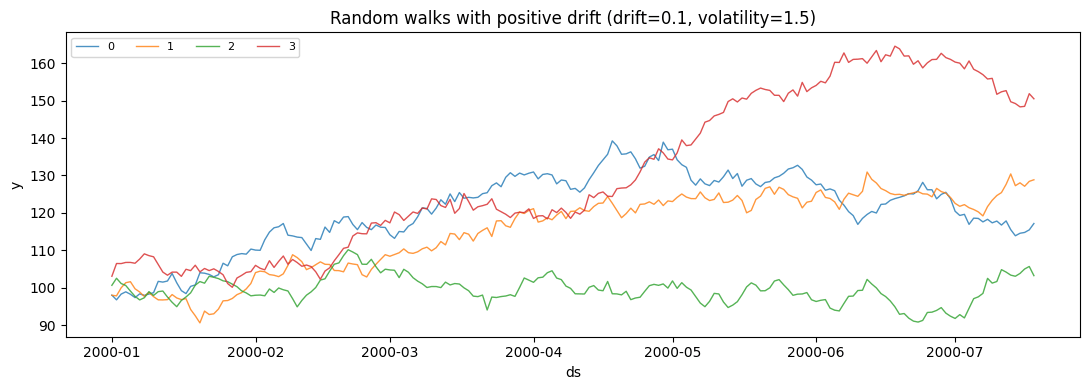 All four series share the same process but a different noise draw: the
common upward pull is the `drift`, the jaggedness is the `volatility`.
Change `seed` for fresh draws, or the parameters to reshape the process.
Every generator’s full parameter set is listed in the [generator
reference](https://github.com/Nixtla/synforecast/blob/main/GENERATORS.md).
## 3. Inject real-world patterns
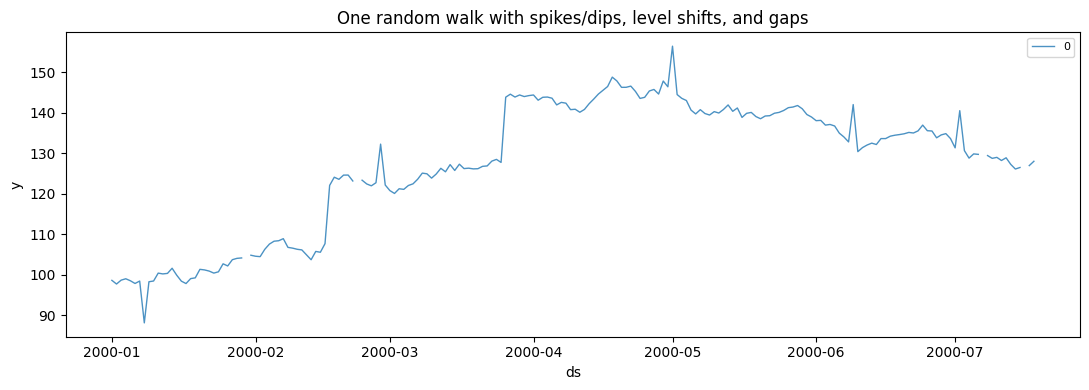
Real series are rarely clean. Any generator can add anomalies, level
shifts, and missing values, so you can measure how a model copes with
them — and because everything is seeded, the messy series is
reproducible.
```python theme={null}
messy = RandomWalkGenerator(
engine="polars",
min_length=200,
max_length=200,
freq="D",
start_value=100.0,
seed=42,
# spikes and dips
anomalies=True,
anomaly_fraction=0.03,
anomaly_types=["spike", "dip"],
# abrupt level shifts
changepoints=True,
num_changepoints=2,
changepoint_type="level",
# gaps
missing_data=True,
missing_rate=0.02,
)
plot_panel(
messy.generate(n_series=1),
"One random walk with spikes/dips, level shifts, and gaps",
)
```
All four series share the same process but a different noise draw: the
common upward pull is the `drift`, the jaggedness is the `volatility`.
Change `seed` for fresh draws, or the parameters to reshape the process.
Every generator’s full parameter set is listed in the [generator
reference](https://github.com/Nixtla/synforecast/blob/main/GENERATORS.md).
## 3. Inject real-world patterns
Real series are rarely clean. Any generator can add anomalies, level
shifts, and missing values, so you can measure how a model copes with
them — and because everything is seeded, the messy series is
reproducible.
```python theme={null}
messy = RandomWalkGenerator(
engine="polars",
min_length=200,
max_length=200,
freq="D",
start_value=100.0,
seed=42,
# spikes and dips
anomalies=True,
anomaly_fraction=0.03,
anomaly_types=["spike", "dip"],
# abrupt level shifts
changepoints=True,
num_changepoints=2,
changepoint_type="level",
# gaps
missing_data=True,
missing_rate=0.02,
)
plot_panel(
messy.generate(n_series=1),
"One random walk with spikes/dips, level shifts, and gaps",
)
```
 > **Each pattern has its own guide**
>
> The knobs above are the quick version. Fine-grained control lives in
> the capability guides: [anomalies](../capabilities/anomalies),
> [changepoints](../capabilities/changepoints), and
> [missingness](../capabilities/missingness). To attach exogenous
> regressors, see [exogenous](../capabilities/exogenous).
## 4. Combine generators into one dataset
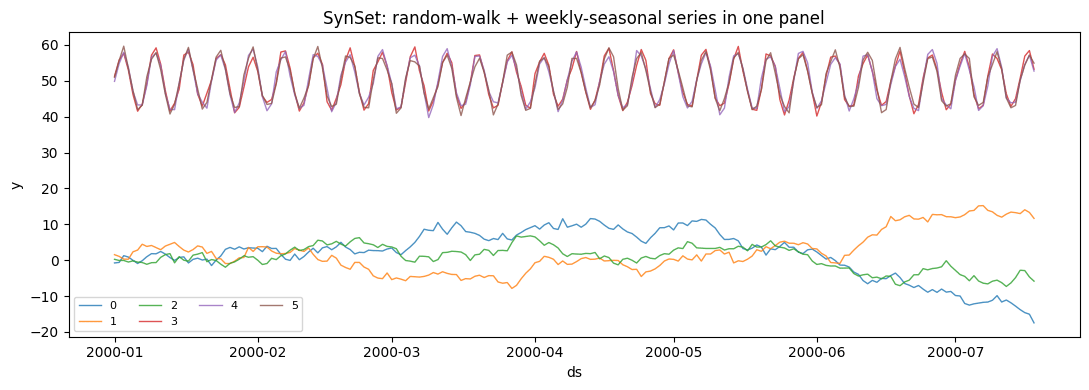
A realistic panel mixes behaviors. `SynSet` composes several generators
into a single long-format dataset, with each generator contributing a
batch of series under its own ids.
```python theme={null}
from synforecast import SynSet
from synforecast.generators import SeasonalGenerator
dataset = SynSet(
[
RandomWalkGenerator(
engine="polars", min_length=200, max_length=200, freq="D", seed=1
),
SeasonalGenerator(
engine="polars",
min_length=200,
max_length=200,
freq="D",
seasonality_period=7,
seasonality_amplitude=8.0,
seed=2,
),
]
)
mixed = dataset.generate(n_series_per_generator=3)
plot_panel(mixed, "SynSet: random-walk + weekly-seasonal series in one panel")
```
> **Each pattern has its own guide**
>
> The knobs above are the quick version. Fine-grained control lives in
> the capability guides: [anomalies](../capabilities/anomalies),
> [changepoints](../capabilities/changepoints), and
> [missingness](../capabilities/missingness). To attach exogenous
> regressors, see [exogenous](../capabilities/exogenous).
## 4. Combine generators into one dataset
A realistic panel mixes behaviors. `SynSet` composes several generators
into a single long-format dataset, with each generator contributing a
batch of series under its own ids.
```python theme={null}
from synforecast import SynSet
from synforecast.generators import SeasonalGenerator
dataset = SynSet(
[
RandomWalkGenerator(
engine="polars", min_length=200, max_length=200, freq="D", seed=1
),
SeasonalGenerator(
engine="polars",
min_length=200,
max_length=200,
freq="D",
seasonality_period=7,
seasonality_amplitude=8.0,
seed=2,
),
]
)
mixed = dataset.generate(n_series_per_generator=3)
plot_panel(mixed, "SynSet: random-walk + weekly-seasonal series in one panel")
```
 > **Reproducibility and the alpha API**
>
> Generation is fully seeded: the same inputs produce the same panel
> across runs and regardless of `n_jobs`. SynForecast is in alpha, so
> seed-identical outputs may change between releases — pin a version if
> you depend on exact values.
## Where to go next
* **Generators** — 31 generator classes from SARIMA, ETS, and GARCH to
Gaussian processes and the
[KernelSynth](../generators/pretraining/kernel_synth) pretraining
recipe. Start with [random
walk](../generators/statistical/random_walk) or
[seasonal](../generators/statistical/seasonal).
* **[Augmentation](../capabilities/augmentation)** — expand a small
real panel with `SynAugment` or TSMixup.
* **[Balanced pool](../capabilities/balanced_pool)** — what
`generate_series` draws from by default, and how to tailor it.
* **Integrations** — end-to-end workflows with
[statsforecast](../integrations/statsforecast),
[mlforecast](../integrations/mlforecast), and
[neuralforecast](../integrations/neuralforecast).
> **Reproducibility and the alpha API**
>
> Generation is fully seeded: the same inputs produce the same panel
> across runs and regardless of `n_jobs`. SynForecast is in alpha, so
> seed-identical outputs may change between releases — pin a version if
> you depend on exact values.
## Where to go next
* **Generators** — 31 generator classes from SARIMA, ETS, and GARCH to
Gaussian processes and the
[KernelSynth](../generators/pretraining/kernel_synth) pretraining
recipe. Start with [random
walk](../generators/statistical/random_walk) or
[seasonal](../generators/statistical/seasonal).
* **[Augmentation](../capabilities/augmentation)** — expand a small
real panel with `SynAugment` or TSMixup.
* **[Balanced pool](../capabilities/balanced_pool)** — what
`generate_series` draws from by default, and how to tailor it.
* **Integrations** — end-to-end workflows with
[statsforecast](../integrations/statsforecast),
[mlforecast](../integrations/mlforecast), and
[neuralforecast](../integrations/neuralforecast).