> ## Documentation Index
> Fetch the complete documentation index at: https://nixtlaverse.nixtla.io/llms.txt
> Use this file to discover all available pages before exploring further.
# Cyclic (irregular cycles)
Cyclic series oscillate, but — unlike a clean seasonal wave — with
*irregular* periods and amplitudes: business cycles, ecological booms
and busts, quasi-periodic signals. The generator overlays one or more
noisy cycles so the period drifts rather than repeating exactly.
> **The model**
>
> $y_t = \text{base} + \text{trend}\cdot t + \sum_{i=1}^{n} A_i \sin\!\big(\psi_i(t)\big) + \varepsilon_t$
>
> Each series superimposes `num_cycles` oscillations whose periods vary
> from cycle to cycle (`cycle_period_std` controls how irregular). Small
> variance approaches a fixed seasonal wave; large variance produces
> genuinely aperiodic cycling.
```python theme={null}
import polars as pl
import matplotlib.pyplot as plt
from synforecast.generators import CyclicGenerator
```
## 1. Cycle length
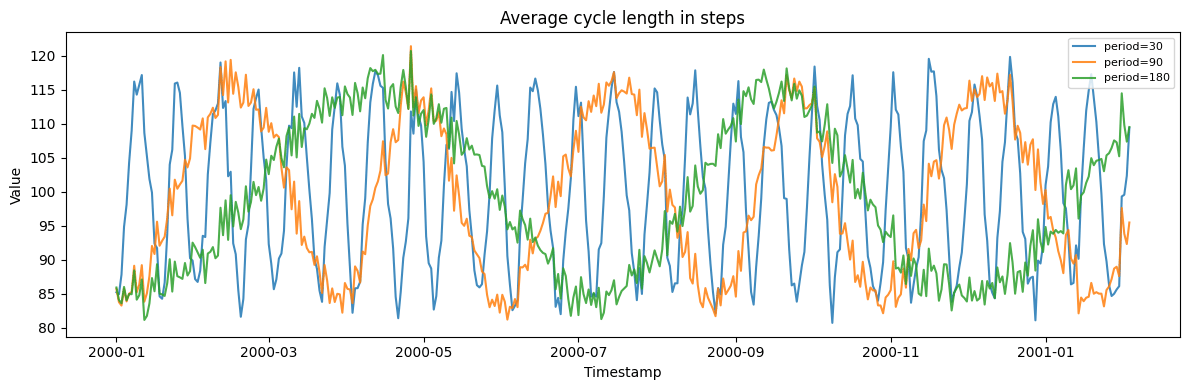
`cycle_period_mean` sets the average cycle length in steps. The period
still drifts within each series, which is what separates a cycle from a
fixed seasonal wave.
```python theme={null}
base = {
"min_length": 400,
"max_length": 400,
"freq": "D",
"base_level": 100.0,
"trend": 0.0,
"cycle_amplitude_mean": 20.0,
"num_cycles": 1,
"noise_std": 2.0,
"seed": 42,
}
fig, ax = plt.subplots(figsize=(12, 4))
for period in (30.0, 90.0, 180.0):
df = CyclicGenerator(
engine="polars", cycle_period_mean=period, **base
).generate(n_series=1)
ax.plot(df["ds"].to_list(), df["y"].to_list(), label=f"period={period:.0f}", alpha=0.85)
ax.set(xlabel="Timestamp", ylabel="Value", title="Average cycle length in steps")
ax.legend(fontsize=8)
plt.tight_layout()
plt.show()
```
 ## 2. Cycle irregularity
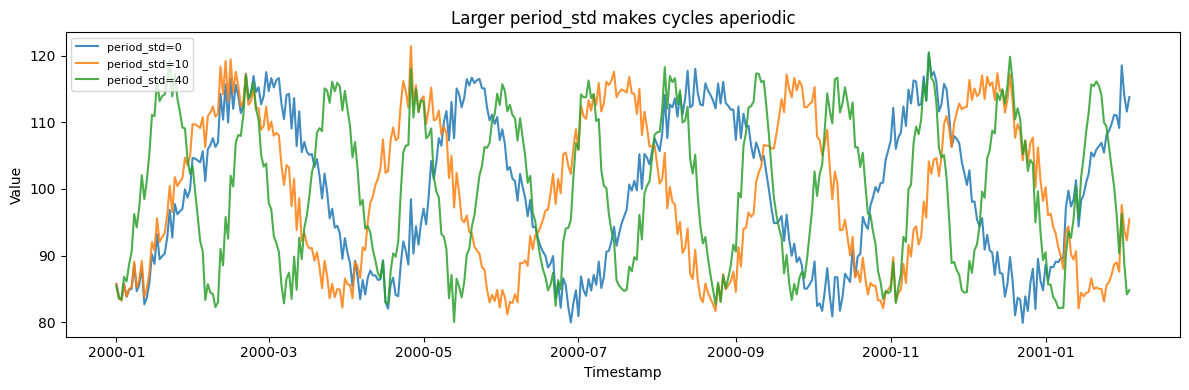
`cycle_period_std` controls how much the period wanders. At zero the
series is close to a fixed seasonal wave; large values give genuinely
aperiodic cycling.
```python theme={null}
fig, ax = plt.subplots(figsize=(12, 4))
for period_std in (0.0, 10.0, 40.0):
df = CyclicGenerator(
engine="polars",
min_length=400,
max_length=400,
freq="D",
base_level=100.0,
trend=0.0,
cycle_period_mean=90.0,
cycle_period_std=period_std,
cycle_amplitude_mean=20.0,
num_cycles=1,
noise_std=2.0,
seed=42,
).generate(n_series=1)
ax.plot(
df["ds"].to_list(), df["y"].to_list(), label=f"period_std={period_std:.0f}", alpha=0.85
)
ax.set(xlabel="Timestamp", ylabel="Value", title="Larger period_std makes cycles aperiodic")
ax.legend(fontsize=8)
plt.tight_layout()
plt.show()
```
## 2. Cycle irregularity
`cycle_period_std` controls how much the period wanders. At zero the
series is close to a fixed seasonal wave; large values give genuinely
aperiodic cycling.
```python theme={null}
fig, ax = plt.subplots(figsize=(12, 4))
for period_std in (0.0, 10.0, 40.0):
df = CyclicGenerator(
engine="polars",
min_length=400,
max_length=400,
freq="D",
base_level=100.0,
trend=0.0,
cycle_period_mean=90.0,
cycle_period_std=period_std,
cycle_amplitude_mean=20.0,
num_cycles=1,
noise_std=2.0,
seed=42,
).generate(n_series=1)
ax.plot(
df["ds"].to_list(), df["y"].to_list(), label=f"period_std={period_std:.0f}", alpha=0.85
)
ax.set(xlabel="Timestamp", ylabel="Value", title="Larger period_std makes cycles aperiodic")
ax.legend(fontsize=8)
plt.tight_layout()
plt.show()
```
 ## 3. Negative trend
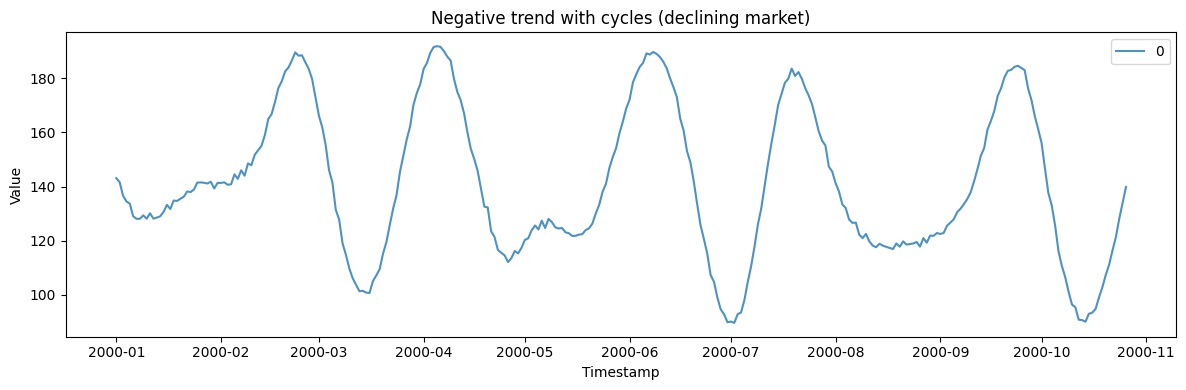
A downward trend combined with cyclical fluctuations.
```python theme={null}
declining_params = {
"min_length": 300,
"max_length": 300,
"freq": "D",
"base_level": 150.0,
"trend": -0.05,
"cycle_period_mean": 50.0,
"cycle_amplitude_mean": 20.0,
"num_cycles": 3,
"seed": 42,
}
declining_gen = CyclicGenerator(engine="polars", **declining_params)
declining_df = declining_gen.generate(n_series=1)
print(f"Generated {len(declining_df)} observations with declining trend")
print(f"Statistics: Mean={declining_df['y'].mean():.4f}, Std={declining_df['y'].std():.4f}")
declining_df.head(10)
```
```text theme={null}
Generated 300 observations with declining trend
Statistics: Mean=140.8307, Std=27.3867
```
| unique\_id | ds | y |
| ---------- | ------------------- | ---------- |
| cat | datetime\[ns] | f64 |
| "0" | 2000-01-01 00:00:00 | 143.101924 |
| "0" | 2000-01-02 00:00:00 | 141.627292 |
| "0" | 2000-01-03 00:00:00 | 136.638082 |
| "0" | 2000-01-04 00:00:00 | 134.529648 |
| "0" | 2000-01-05 00:00:00 | 133.656044 |
| "0" | 2000-01-06 00:00:00 | 129.039617 |
| "0" | 2000-01-07 00:00:00 | 128.071289 |
| "0" | 2000-01-08 00:00:00 | 128.080343 |
| "0" | 2000-01-09 00:00:00 | 129.365766 |
| "0" | 2000-01-10 00:00:00 | 128.117344 |
```python theme={null}
fig, ax = plt.subplots(figsize=(12, 4))
for uid in declining_df["unique_id"].unique().to_list():
series = declining_df.filter(pl.col("unique_id") == uid)
ax.plot(series["ds"].to_list(), series["y"].to_list(), label=uid, alpha=0.8)
ax.set_xlabel("Timestamp")
ax.set_ylabel("Value")
ax.set_title("Negative trend with cycles (declining market)")
ax.legend()
plt.tight_layout()
plt.show()
```
## 3. Negative trend
A downward trend combined with cyclical fluctuations.
```python theme={null}
declining_params = {
"min_length": 300,
"max_length": 300,
"freq": "D",
"base_level": 150.0,
"trend": -0.05,
"cycle_period_mean": 50.0,
"cycle_amplitude_mean": 20.0,
"num_cycles": 3,
"seed": 42,
}
declining_gen = CyclicGenerator(engine="polars", **declining_params)
declining_df = declining_gen.generate(n_series=1)
print(f"Generated {len(declining_df)} observations with declining trend")
print(f"Statistics: Mean={declining_df['y'].mean():.4f}, Std={declining_df['y'].std():.4f}")
declining_df.head(10)
```
```text theme={null}
Generated 300 observations with declining trend
Statistics: Mean=140.8307, Std=27.3867
```
| unique\_id | ds | y |
| ---------- | ------------------- | ---------- |
| cat | datetime\[ns] | f64 |
| "0" | 2000-01-01 00:00:00 | 143.101924 |
| "0" | 2000-01-02 00:00:00 | 141.627292 |
| "0" | 2000-01-03 00:00:00 | 136.638082 |
| "0" | 2000-01-04 00:00:00 | 134.529648 |
| "0" | 2000-01-05 00:00:00 | 133.656044 |
| "0" | 2000-01-06 00:00:00 | 129.039617 |
| "0" | 2000-01-07 00:00:00 | 128.071289 |
| "0" | 2000-01-08 00:00:00 | 128.080343 |
| "0" | 2000-01-09 00:00:00 | 129.365766 |
| "0" | 2000-01-10 00:00:00 | 128.117344 |
```python theme={null}
fig, ax = plt.subplots(figsize=(12, 4))
for uid in declining_df["unique_id"].unique().to_list():
series = declining_df.filter(pl.col("unique_id") == uid)
ax.plot(series["ds"].to_list(), series["y"].to_list(), label=uid, alpha=0.8)
ax.set_xlabel("Timestamp")
ax.set_ylabel("Value")
ax.set_title("Negative trend with cycles (declining market)")
ax.legend()
plt.tight_layout()
plt.show()
```
 ## 4. Overlapping cycles
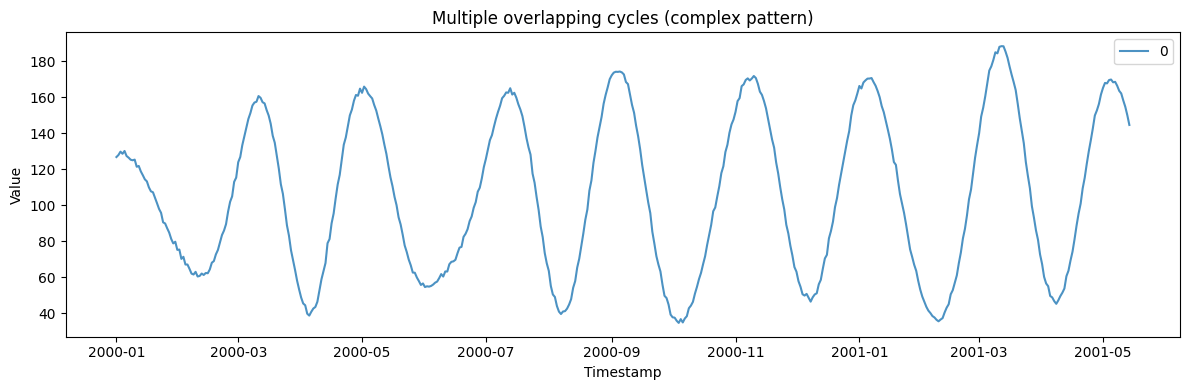
Five overlapping cycle components create a complex, realistic pattern.
```python theme={null}
complex_params = {
"min_length": 500,
"max_length": 500,
"freq": "D",
"base_level": 100.0,
"trend": 0.02,
"cycle_period_mean": 60.0,
"cycle_amplitude_mean": 15.0,
"num_cycles": 5,
"seed": 42,
}
complex_gen = CyclicGenerator(engine="polars", **complex_params)
complex_df = complex_gen.generate(n_series=1)
print(f"Generated {len(complex_df)} observations with multiple overlapping cycles")
print(f"Statistics: Mean={complex_df['y'].mean():.4f}, Std={complex_df['y'].std():.4f}")
complex_df.head(10)
```
```text theme={null}
Generated 500 observations with multiple overlapping cycles
Statistics: Mean=105.8392, Std=43.9463
```
| unique\_id | ds | y |
| ---------- | ------------------- | ---------- |
| cat | datetime\[ns] | f64 |
| "0" | 2000-01-01 00:00:00 | 126.751732 |
| "0" | 2000-01-02 00:00:00 | 127.885824 |
| "0" | 2000-01-03 00:00:00 | 129.749177 |
| "0" | 2000-01-04 00:00:00 | 128.563635 |
| "0" | 2000-01-05 00:00:00 | 130.119181 |
| "0" | 2000-01-06 00:00:00 | 127.31363 |
| "0" | 2000-01-07 00:00:00 | 126.418862 |
| "0" | 2000-01-08 00:00:00 | 125.266044 |
| "0" | 2000-01-09 00:00:00 | 124.954641 |
| "0" | 2000-01-10 00:00:00 | 125.315938 |
```python theme={null}
fig, ax = plt.subplots(figsize=(12, 4))
for uid in complex_df["unique_id"].unique().to_list():
series = complex_df.filter(pl.col("unique_id") == uid)
ax.plot(series["ds"].to_list(), series["y"].to_list(), label=uid, alpha=0.8)
ax.set_xlabel("Timestamp")
ax.set_ylabel("Value")
ax.set_title("Multiple overlapping cycles (complex pattern)")
ax.legend()
plt.tight_layout()
plt.show()
```
## 4. Overlapping cycles
Five overlapping cycle components create a complex, realistic pattern.
```python theme={null}
complex_params = {
"min_length": 500,
"max_length": 500,
"freq": "D",
"base_level": 100.0,
"trend": 0.02,
"cycle_period_mean": 60.0,
"cycle_amplitude_mean": 15.0,
"num_cycles": 5,
"seed": 42,
}
complex_gen = CyclicGenerator(engine="polars", **complex_params)
complex_df = complex_gen.generate(n_series=1)
print(f"Generated {len(complex_df)} observations with multiple overlapping cycles")
print(f"Statistics: Mean={complex_df['y'].mean():.4f}, Std={complex_df['y'].std():.4f}")
complex_df.head(10)
```
```text theme={null}
Generated 500 observations with multiple overlapping cycles
Statistics: Mean=105.8392, Std=43.9463
```
| unique\_id | ds | y |
| ---------- | ------------------- | ---------- |
| cat | datetime\[ns] | f64 |
| "0" | 2000-01-01 00:00:00 | 126.751732 |
| "0" | 2000-01-02 00:00:00 | 127.885824 |
| "0" | 2000-01-03 00:00:00 | 129.749177 |
| "0" | 2000-01-04 00:00:00 | 128.563635 |
| "0" | 2000-01-05 00:00:00 | 130.119181 |
| "0" | 2000-01-06 00:00:00 | 127.31363 |
| "0" | 2000-01-07 00:00:00 | 126.418862 |
| "0" | 2000-01-08 00:00:00 | 125.266044 |
| "0" | 2000-01-09 00:00:00 | 124.954641 |
| "0" | 2000-01-10 00:00:00 | 125.315938 |
```python theme={null}
fig, ax = plt.subplots(figsize=(12, 4))
for uid in complex_df["unique_id"].unique().to_list():
series = complex_df.filter(pl.col("unique_id") == uid)
ax.plot(series["ds"].to_list(), series["y"].to_list(), label=uid, alpha=0.8)
ax.set_xlabel("Timestamp")
ax.set_ylabel("Value")
ax.set_title("Multiple overlapping cycles (complex pattern)")
ax.legend()
plt.tight_layout()
plt.show()
```
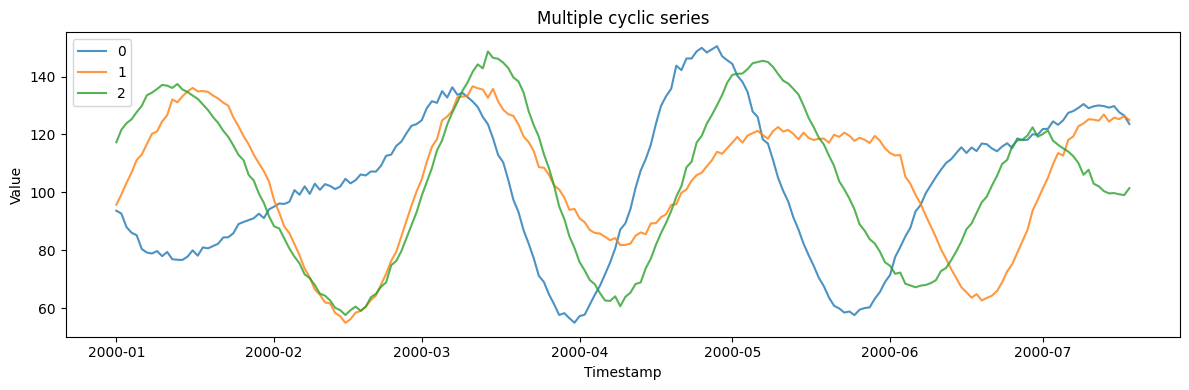
 ## 5. Multiple series
Generate multiple independent cyclic series in one call.
```python theme={null}
multi_params = {
"min_length": 200,
"max_length": 200,
"freq": "D",
"base_level": 100.0,
"trend": 0.03,
"cycle_period_mean": 60.0,
"cycle_amplitude_mean": 20.0,
"num_cycles": 3,
"seed": 42,
}
multi_gen = CyclicGenerator(engine="polars", **multi_params)
multi_df = multi_gen.generate(n_series=3)
print(f"Generated 3 series with {len(multi_df)} total observations")
print(f"Overall Statistics: Mean={multi_df['y'].mean():.4f}, Std={multi_df['y'].std():.4f}")
multi_df.filter(pl.col("unique_id") == "0").head(10)
```
```text theme={null}
Generated 3 series with 600 total observations
Overall Statistics: Mean=103.3095, Std=24.7829
```
| unique\_id | ds | y |
| ---------- | ------------------- | --------- |
| cat | datetime\[ns] | f64 |
| "0" | 2000-01-01 00:00:00 | 93.663885 |
| "0" | 2000-01-02 00:00:00 | 92.67384 |
| "0" | 2000-01-03 00:00:00 | 88.006548 |
| "0" | 2000-01-04 00:00:00 | 86.059544 |
| "0" | 2000-01-05 00:00:00 | 85.195164 |
| "0" | 2000-01-06 00:00:00 | 80.448824 |
| "0" | 2000-01-07 00:00:00 | 79.228091 |
| "0" | 2000-01-08 00:00:00 | 78.881414 |
| "0" | 2000-01-09 00:00:00 | 79.728552 |
| "0" | 2000-01-10 00:00:00 | 77.980928 |
```python theme={null}
fig, ax = plt.subplots(figsize=(12, 4))
for uid in multi_df["unique_id"].unique().to_list():
series = multi_df.filter(pl.col("unique_id") == uid)
ax.plot(series["ds"].to_list(), series["y"].to_list(), label=uid, alpha=0.8)
ax.set_xlabel("Timestamp")
ax.set_ylabel("Value")
ax.set_title("Multiple cyclic series")
ax.legend()
plt.tight_layout()
plt.show()
```
## 5. Multiple series
Generate multiple independent cyclic series in one call.
```python theme={null}
multi_params = {
"min_length": 200,
"max_length": 200,
"freq": "D",
"base_level": 100.0,
"trend": 0.03,
"cycle_period_mean": 60.0,
"cycle_amplitude_mean": 20.0,
"num_cycles": 3,
"seed": 42,
}
multi_gen = CyclicGenerator(engine="polars", **multi_params)
multi_df = multi_gen.generate(n_series=3)
print(f"Generated 3 series with {len(multi_df)} total observations")
print(f"Overall Statistics: Mean={multi_df['y'].mean():.4f}, Std={multi_df['y'].std():.4f}")
multi_df.filter(pl.col("unique_id") == "0").head(10)
```
```text theme={null}
Generated 3 series with 600 total observations
Overall Statistics: Mean=103.3095, Std=24.7829
```
| unique\_id | ds | y |
| ---------- | ------------------- | --------- |
| cat | datetime\[ns] | f64 |
| "0" | 2000-01-01 00:00:00 | 93.663885 |
| "0" | 2000-01-02 00:00:00 | 92.67384 |
| "0" | 2000-01-03 00:00:00 | 88.006548 |
| "0" | 2000-01-04 00:00:00 | 86.059544 |
| "0" | 2000-01-05 00:00:00 | 85.195164 |
| "0" | 2000-01-06 00:00:00 | 80.448824 |
| "0" | 2000-01-07 00:00:00 | 79.228091 |
| "0" | 2000-01-08 00:00:00 | 78.881414 |
| "0" | 2000-01-09 00:00:00 | 79.728552 |
| "0" | 2000-01-10 00:00:00 | 77.980928 |
```python theme={null}
fig, ax = plt.subplots(figsize=(12, 4))
for uid in multi_df["unique_id"].unique().to_list():
series = multi_df.filter(pl.col("unique_id") == uid)
ax.plot(series["ds"].to_list(), series["y"].to_list(), label=uid, alpha=0.8)
ax.set_xlabel("Timestamp")
ax.set_ylabel("Value")
ax.set_title("Multiple cyclic series")
ax.legend()
plt.tight_layout()
plt.show()
```
 > **Related generators**
>
> * [Seasonal](../statistical/seasonal) — a fixed, exactly repeating
> period.
> * [Gaussian process](../multivariate/gaussian_process) — periodic
> kernels for smooth quasi-periodicity.
>
> Cycle-count and irregularity parameters are in the [generator
> reference](https://github.com/Nixtla/synforecast/blob/main/GENERATORS.md).
> **Related generators**
>
> * [Seasonal](../statistical/seasonal) — a fixed, exactly repeating
> period.
> * [Gaussian process](../multivariate/gaussian_process) — periodic
> kernels for smooth quasi-periodicity.
>
> Cycle-count and irregularity parameters are in the [generator
> reference](https://github.com/Nixtla/synforecast/blob/main/GENERATORS.md).