> ## Documentation Index
> Fetch the complete documentation index at: https://nixtlaverse.nixtla.io/llms.txt
> Use this file to discover all available pages before exploring further.
# Random walk
A random walk is the canonical non-stationary series: each value is the
previous one plus a random step, optionally nudged by a constant drift.
It is the process behind the *naive* forecast (tomorrow ≈ today), a
first model of efficient-market prices, and a useful stress test for
whether a pipeline handles trends and growing variance rather than
assuming a stable mean.
> **The model**
>
> $y_t = y_{t-1} + \mu + \sigma\,\varepsilon_t, \qquad \varepsilon_t \sim \mathcal{N}(0, 1)$
>
> * `drift` ($\mu$) — the constant step added each period; a
> deterministic trend.
> * `volatility` ($\sigma$) — the standard deviation of the random
> step.
> * `start_value` ($y_0$) — where every series begins.
>
> Because steps accumulate, the variance grows with time — the series
> has no fixed mean to revert to.
## Generate
Instantiate the generator and draw a few series. All outputs are
long-format (`unique_id`, `ds`, `y`).
```python theme={null}
import matplotlib.pyplot as plt
import polars as pl
from synforecast.generators import RandomWalkGenerator
def plot_panel(df, title):
"""Plot each series in a long-format panel on a shared axis."""
fig, ax = plt.subplots(figsize=(11, 4))
for uid in df["unique_id"].unique(maintain_order=True).to_list():
series = df.filter(pl.col("unique_id") == uid)
ax.plot(series["ds"], series["y"], linewidth=1, alpha=0.85, label=str(uid))
ax.set(title=title, xlabel="ds", ylabel="y")
ax.legend(fontsize=8)
plt.tight_layout()
plt.show()
generator = RandomWalkGenerator(
engine="polars",
min_length=200,
max_length=200,
freq="D",
drift=0.1,
volatility=1.5,
start_value=100.0,
seed=42,
)
walks = generator.generate(n_series=3)
plot_panel(walks, "Random walks (drift=0.1, volatility=1.5)")
```
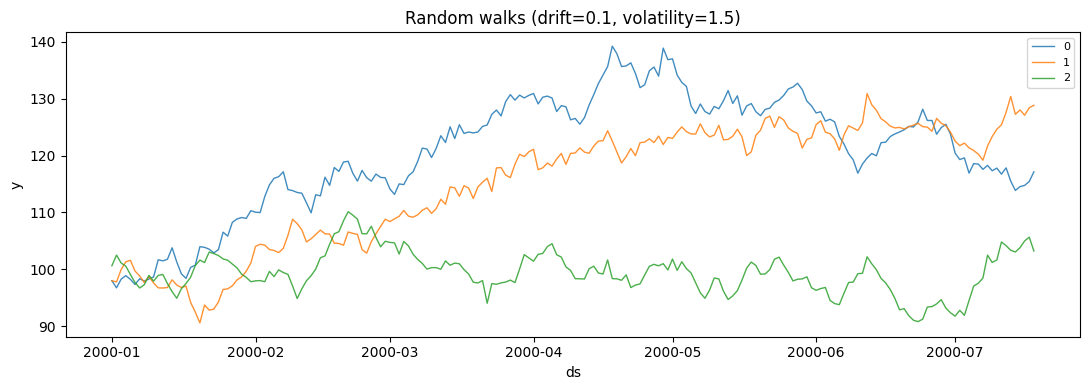 The three series share the same process but a different noise draw. They
all start at 100 and trend gently upward — that shared pull is the drift
— while wandering by an amount set by the volatility. Notice how they
fan out over time: that spreading is the growing variance a random walk
always produces.
## Control the process
`drift` sets the trend and `volatility` sets the noise. Holding
volatility fixed, larger drift turns a flat wander into a clear trend.
```python theme={null}
fig, ax = plt.subplots(figsize=(11, 4))
for drift in (0.0, 0.1, 0.4):
series = RandomWalkGenerator(
engine="polars",
min_length=200,
max_length=200,
freq="D",
drift=drift,
volatility=1.0,
start_value=100.0,
seed=0,
).generate(n_series=1)
ax.plot(series["ds"], series["y"], linewidth=1.2, label=f"drift={drift}")
ax.set(title="Same noise seed, increasing drift", xlabel="ds", ylabel="y")
ax.legend()
plt.tight_layout()
plt.show()
```
The three series share the same process but a different noise draw. They
all start at 100 and trend gently upward — that shared pull is the drift
— while wandering by an amount set by the volatility. Notice how they
fan out over time: that spreading is the growing variance a random walk
always produces.
## Control the process
`drift` sets the trend and `volatility` sets the noise. Holding
volatility fixed, larger drift turns a flat wander into a clear trend.
```python theme={null}
fig, ax = plt.subplots(figsize=(11, 4))
for drift in (0.0, 0.1, 0.4):
series = RandomWalkGenerator(
engine="polars",
min_length=200,
max_length=200,
freq="D",
drift=drift,
volatility=1.0,
start_value=100.0,
seed=0,
).generate(n_series=1)
ax.plot(series["ds"], series["y"], linewidth=1.2, label=f"drift={drift}")
ax.set(title="Same noise seed, increasing drift", xlabel="ds", ylabel="y")
ax.legend()
plt.tight_layout()
plt.show()
```
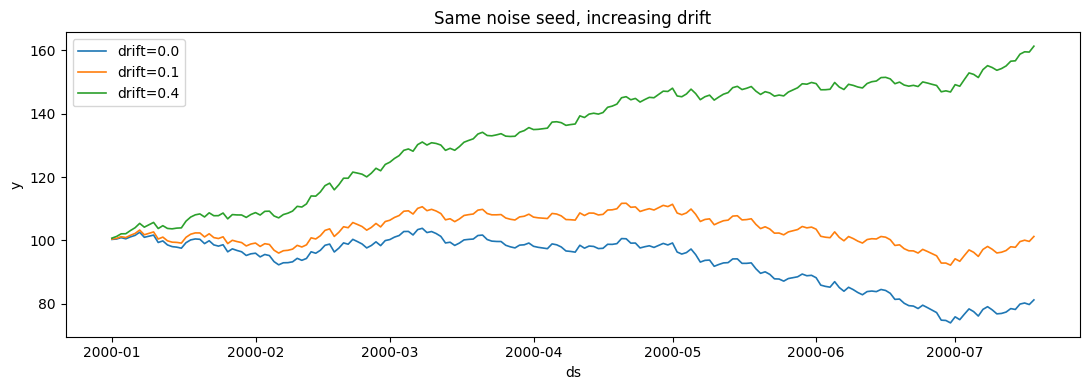 Sharing the seed isolates the effect: the wiggles are identical, but a
larger drift lifts the whole path. Raise `volatility` instead and the
paths would keep this trend while wandering further from it.
## Statistics by series
Summary statistics vary widely between series even from one generator —
a direct consequence of the accumulating, unbounded variance.
```python theme={null}
walks.group_by("unique_id").agg(
pl.len().alias("count"),
pl.col("y").min().round(2).alias("min"),
pl.col("y").max().round(2).alias("max"),
pl.col("y").mean().round(2).alias("mean"),
pl.col("y").std().round(2).alias("std"),
).sort("unique_id")
```
| unique\_id | count | min | max | mean | std |
| ---------- | ----- | ----- | ------ | ------ | ----- |
| cat | u32 | f64 | f64 | f64 | f64 |
| "0" | 200 | 96.74 | 139.24 | 120.67 | 10.36 |
| "1" | 200 | 90.58 | 130.9 | 115.29 | 10.56 |
| "2" | 200 | 90.8 | 110.13 | 99.45 | 3.61 |
> **Related generators**
>
> * [Geometric Brownian
> motion](../stochastic/geometric_brownian_motion) — a
> *multiplicative* random walk for strictly positive series like
> prices.
> * [SARIMA](sarima) with `d=1` — a random walk with added
> autoregressive/moving-average structure.
> * Add trend breaks or outliers with the
> [changepoints](../../capabilities/changepoints) and
> [anomalies](../../capabilities/anomalies) options.
>
> Every parameter is documented in the [generator
> reference](https://github.com/Nixtla/synforecast/blob/main/GENERATORS.md).
Sharing the seed isolates the effect: the wiggles are identical, but a
larger drift lifts the whole path. Raise `volatility` instead and the
paths would keep this trend while wandering further from it.
## Statistics by series
Summary statistics vary widely between series even from one generator —
a direct consequence of the accumulating, unbounded variance.
```python theme={null}
walks.group_by("unique_id").agg(
pl.len().alias("count"),
pl.col("y").min().round(2).alias("min"),
pl.col("y").max().round(2).alias("max"),
pl.col("y").mean().round(2).alias("mean"),
pl.col("y").std().round(2).alias("std"),
).sort("unique_id")
```
| unique\_id | count | min | max | mean | std |
| ---------- | ----- | ----- | ------ | ------ | ----- |
| cat | u32 | f64 | f64 | f64 | f64 |
| "0" | 200 | 96.74 | 139.24 | 120.67 | 10.36 |
| "1" | 200 | 90.58 | 130.9 | 115.29 | 10.56 |
| "2" | 200 | 90.8 | 110.13 | 99.45 | 3.61 |
> **Related generators**
>
> * [Geometric Brownian
> motion](../stochastic/geometric_brownian_motion) — a
> *multiplicative* random walk for strictly positive series like
> prices.
> * [SARIMA](sarima) with `d=1` — a random walk with added
> autoregressive/moving-average structure.
> * Add trend breaks or outliers with the
> [changepoints](../../capabilities/changepoints) and
> [anomalies](../../capabilities/anomalies) options.
>
> Every parameter is documented in the [generator
> reference](https://github.com/Nixtla/synforecast/blob/main/GENERATORS.md).