> ## Documentation Index
> Fetch the complete documentation index at: https://nixtlaverse.nixtla.io/llms.txt
> Use this file to discover all available pages before exploring further.
# IoT sensor
A real sensor feed is more than a clean signal: it drifts as the device
ages, grows noisier as the battery drains, and occasionally fails.
`IoTSensorGenerator` reproduces these artifacts so you can test
monitoring and anomaly-detection pipelines against realistic device
behavior.
> **The model**
>
> A baseline signal is corrupted by calibration `drift_rate`,
> `battery_degradation_rate`, and intermittent or permanent faults set
> by `failure_probability` and `failure_type`. Leave them at zero for a
> healthy sensor, or turn them up to simulate a degrading or failing
> one.
```python theme={null}
import numpy as np
import polars as pl
import matplotlib.pyplot as plt
from synforecast.generators import IoTSensorGenerator
```
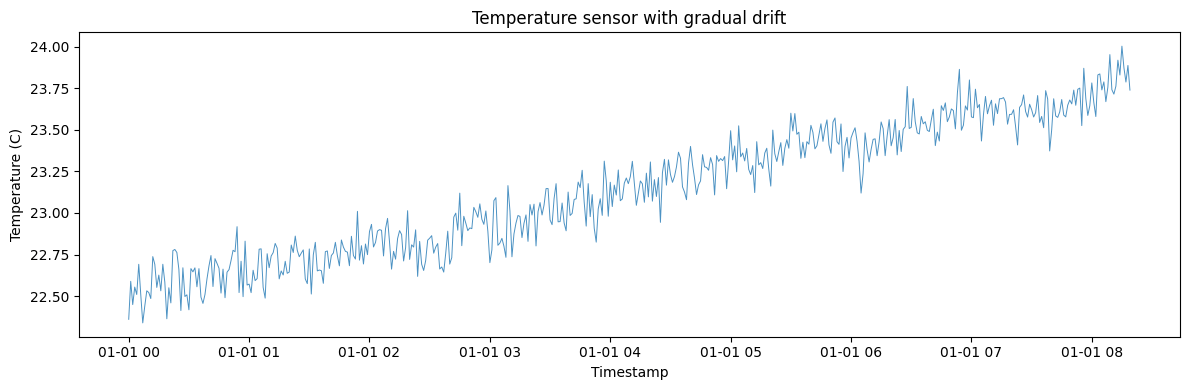
## 1. Temperature sensor with gradual drift
Simulate a temperature sensor that gradually drifts over time due to
calibration issues.
```python theme={null}
params_temp = {
"min_length": 500,
"max_length": 500,
"freq": "min",
"n_sensors": 1,
"sensor_type": "temperature",
"base_value": 22.0,
"drift_rate": 0.002,
"measurement_noise": 0.1,
"calibration_error": 0.5,
"seed": 42,
}
gen_temp = IoTSensorGenerator(engine="polars", **params_temp)
df_temp = gen_temp.generate(n_series=1)
print(f"Generated {len(df_temp)} temperature readings")
df_temp.head(20)
```
```text theme={null}
Generated 500 temperature readings
```
| unique\_id | ds | y |
| ---------- | ------------------- | --------- |
| cat | datetime\[ns] | f64 |
| "0" | 2000-01-01 00:00:00 | 22.359841 |
| "0" | 2000-01-01 00:01:00 | 22.588446 |
| "0" | 2000-01-01 00:02:00 | 22.448393 |
| "0" | 2000-01-01 00:03:00 | 22.553855 |
| "0" | 2000-01-01 00:04:00 | 22.509143 |
| … | … | … |
| "0" | 2000-01-01 00:15:00 | 22.626105 |
| "0" | 2000-01-01 00:16:00 | 22.531311 |
| "0" | 2000-01-01 00:17:00 | 22.691271 |
| "0" | 2000-01-01 00:18:00 | 22.582547 |
| "0" | 2000-01-01 00:19:00 | 22.36304 |
```python theme={null}
fig, ax = plt.subplots(figsize=(12, 4))
ax.plot(df_temp["ds"].to_list(), df_temp["y"].to_list(), alpha=0.8, linewidth=0.7)
ax.set_xlabel("Timestamp")
ax.set_ylabel("Temperature (C)")
ax.set_title("Temperature sensor with gradual drift")
plt.tight_layout()
plt.show()
```
 ```python theme={null}
values = df_temp["y"].to_numpy()
print(f"Temperature statistics:")
print(f" Mean: {np.mean(values):.2f} C")
print(f" Min: {np.min(values):.2f} C")
print(f" Max: {np.max(values):.2f} C")
print(f" Std: {np.std(values):.2f} C")
first_100 = np.mean(values[:100])
last_100 = np.mean(values[-100:])
print(f" Drift: {last_100 - first_100:.2f} C (first 100 vs last 100)")
```
```text theme={null}
Temperature statistics:
Mean: 23.14 C
Min: 22.34 C
Max: 24.00 C
Std: 0.39 C
Drift: 1.02 C (first 100 vs last 100)
```
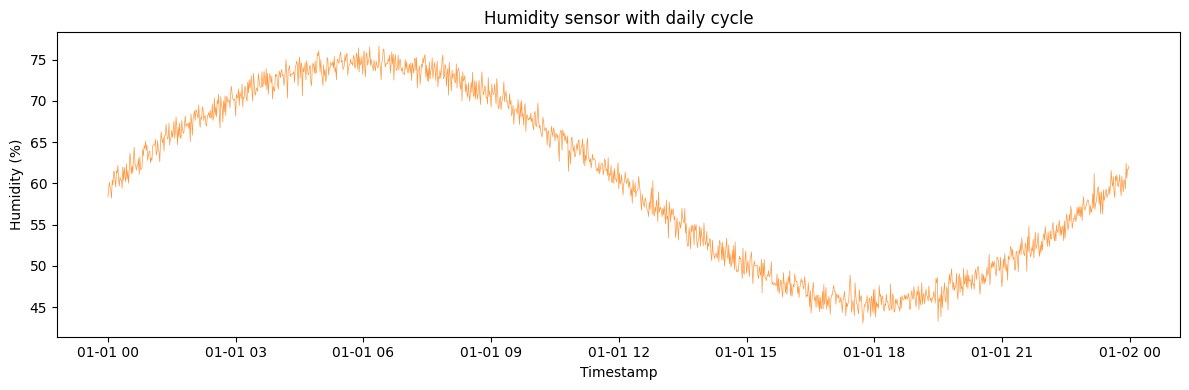
## 2. Humidity sensor with daily cycle
Generate 24 hours of humidity readings at 1-minute intervals with a
daily seasonal pattern.
```python theme={null}
params_humidity = {
"min_length": 1440,
"max_length": 1440,
"freq": "min",
"n_sensors": 1,
"sensor_type": "humidity",
"base_value": 60.0,
"seasonal_period": 1440,
"seasonal_amplitude": 15.0,
"measurement_noise": 1.0,
"seed": 123,
}
gen_humidity = IoTSensorGenerator(engine="polars", **params_humidity)
df_humidity = gen_humidity.generate(n_series=1)
print(f"Generated 24 hours of humidity readings (1-minute intervals)")
values_humidity = df_humidity["y"].to_numpy()
print(f"\nHumidity statistics:")
print(f" Mean: {np.mean(values_humidity):.1f}%")
print(f" Min: {np.min(values_humidity):.1f}%")
print(f" Max: {np.max(values_humidity):.1f}%")
df_humidity.filter(pl.col("ds").dt.minute() == 0).filter(
pl.col("ds").dt.hour() % 2 == 0
).head(12)
```
```text theme={null}
Generated 24 hours of humidity readings (1-minute intervals)
Humidity statistics:
Mean: 60.3%
Min: 43.1%
Max: 76.6%
```
| unique\_id | ds | y |
| ---------- | ------------------- | --------- |
| cat | datetime\[ns] | f64 |
| "0" | 2000-01-01 00:00:00 | 58.351737 |
| "0" | 2000-01-01 02:00:00 | 67.881279 |
| "0" | 2000-01-01 04:00:00 | 71.417134 |
| "0" | 2000-01-01 06:00:00 | 75.064438 |
| "0" | 2000-01-01 08:00:00 | 70.703289 |
| … | … | … |
| "0" | 2000-01-01 14:00:00 | 55.208747 |
| "0" | 2000-01-01 16:00:00 | 47.778869 |
| "0" | 2000-01-01 18:00:00 | 44.222302 |
| "0" | 2000-01-01 20:00:00 | 49.031773 |
| "0" | 2000-01-01 22:00:00 | 53.124016 |
```python theme={null}
fig, ax = plt.subplots(figsize=(12, 4))
ax.plot(df_humidity["ds"].to_list(), df_humidity["y"].to_list(), alpha=0.8, linewidth=0.5, color="C1")
ax.set_xlabel("Timestamp")
ax.set_ylabel("Humidity (%)")
ax.set_title("Humidity sensor with daily cycle")
plt.tight_layout()
plt.show()
```
```python theme={null}
values = df_temp["y"].to_numpy()
print(f"Temperature statistics:")
print(f" Mean: {np.mean(values):.2f} C")
print(f" Min: {np.min(values):.2f} C")
print(f" Max: {np.max(values):.2f} C")
print(f" Std: {np.std(values):.2f} C")
first_100 = np.mean(values[:100])
last_100 = np.mean(values[-100:])
print(f" Drift: {last_100 - first_100:.2f} C (first 100 vs last 100)")
```
```text theme={null}
Temperature statistics:
Mean: 23.14 C
Min: 22.34 C
Max: 24.00 C
Std: 0.39 C
Drift: 1.02 C (first 100 vs last 100)
```
## 2. Humidity sensor with daily cycle
Generate 24 hours of humidity readings at 1-minute intervals with a
daily seasonal pattern.
```python theme={null}
params_humidity = {
"min_length": 1440,
"max_length": 1440,
"freq": "min",
"n_sensors": 1,
"sensor_type": "humidity",
"base_value": 60.0,
"seasonal_period": 1440,
"seasonal_amplitude": 15.0,
"measurement_noise": 1.0,
"seed": 123,
}
gen_humidity = IoTSensorGenerator(engine="polars", **params_humidity)
df_humidity = gen_humidity.generate(n_series=1)
print(f"Generated 24 hours of humidity readings (1-minute intervals)")
values_humidity = df_humidity["y"].to_numpy()
print(f"\nHumidity statistics:")
print(f" Mean: {np.mean(values_humidity):.1f}%")
print(f" Min: {np.min(values_humidity):.1f}%")
print(f" Max: {np.max(values_humidity):.1f}%")
df_humidity.filter(pl.col("ds").dt.minute() == 0).filter(
pl.col("ds").dt.hour() % 2 == 0
).head(12)
```
```text theme={null}
Generated 24 hours of humidity readings (1-minute intervals)
Humidity statistics:
Mean: 60.3%
Min: 43.1%
Max: 76.6%
```
| unique\_id | ds | y |
| ---------- | ------------------- | --------- |
| cat | datetime\[ns] | f64 |
| "0" | 2000-01-01 00:00:00 | 58.351737 |
| "0" | 2000-01-01 02:00:00 | 67.881279 |
| "0" | 2000-01-01 04:00:00 | 71.417134 |
| "0" | 2000-01-01 06:00:00 | 75.064438 |
| "0" | 2000-01-01 08:00:00 | 70.703289 |
| … | … | … |
| "0" | 2000-01-01 14:00:00 | 55.208747 |
| "0" | 2000-01-01 16:00:00 | 47.778869 |
| "0" | 2000-01-01 18:00:00 | 44.222302 |
| "0" | 2000-01-01 20:00:00 | 49.031773 |
| "0" | 2000-01-01 22:00:00 | 53.124016 |
```python theme={null}
fig, ax = plt.subplots(figsize=(12, 4))
ax.plot(df_humidity["ds"].to_list(), df_humidity["y"].to_list(), alpha=0.8, linewidth=0.5, color="C1")
ax.set_xlabel("Timestamp")
ax.set_ylabel("Humidity (%)")
ax.set_title("Humidity sensor with daily cycle")
plt.tight_layout()
plt.show()
```
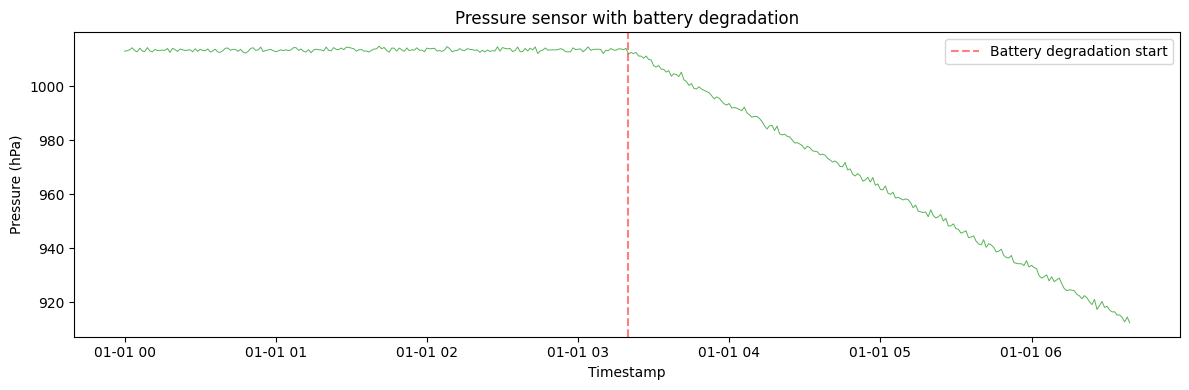
 ## 3. Pressure sensor with battery degradation
Simulate a pressure sensor where measurement quality degrades as battery
life decreases.
```python theme={null}
params_pressure = {
"min_length": 400,
"max_length": 400,
"freq": "min",
"n_sensors": 1,
"sensor_type": "pressure",
"base_value": 1013.25,
"measurement_noise": 0.5,
"battery_life": 200,
"battery_degradation_rate": 0.005,
"seed": 456,
}
gen_pressure = IoTSensorGenerator(engine="polars", **params_pressure)
df_pressure = gen_pressure.generate(n_series=1)
print(f"Generated {len(df_pressure)} pressure readings")
print(f"Battery degradation starts at reading 200")
values_pressure = df_pressure["y"].to_numpy()
first_half_std = np.std(values_pressure[:200])
second_half_std = np.std(values_pressure[200:])
print(f"\nPressure quality:")
print(f" Before battery degradation (readings 0-200):")
print(f" Std: {first_half_std:.2f} hPa")
print(f" After battery degradation (readings 200-400):")
print(f" Std: {second_half_std:.2f} hPa")
print(f" Quality degradation: {((second_half_std/first_half_std - 1) * 100):.1f}% increase in noise")
```
```text theme={null}
Generated 400 pressure readings
Battery degradation starts at reading 200
Pressure quality:
Before battery degradation (readings 0-200):
Std: 0.54 hPa
After battery degradation (readings 200-400):
Std: 29.20 hPa
Quality degradation: 5341.6% increase in noise
```
```python theme={null}
fig, ax = plt.subplots(figsize=(12, 4))
ax.plot(df_pressure["ds"].to_list(), df_pressure["y"].to_list(), alpha=0.8, linewidth=0.7, color="C2")
ax.axvline(x=df_pressure["ds"].to_list()[200], color="red", linestyle="--", alpha=0.5, label="Battery degradation start")
ax.set_xlabel("Timestamp")
ax.set_ylabel("Pressure (hPa)")
ax.set_title("Pressure sensor with battery degradation")
ax.legend()
plt.tight_layout()
plt.show()
```
## 3. Pressure sensor with battery degradation
Simulate a pressure sensor where measurement quality degrades as battery
life decreases.
```python theme={null}
params_pressure = {
"min_length": 400,
"max_length": 400,
"freq": "min",
"n_sensors": 1,
"sensor_type": "pressure",
"base_value": 1013.25,
"measurement_noise": 0.5,
"battery_life": 200,
"battery_degradation_rate": 0.005,
"seed": 456,
}
gen_pressure = IoTSensorGenerator(engine="polars", **params_pressure)
df_pressure = gen_pressure.generate(n_series=1)
print(f"Generated {len(df_pressure)} pressure readings")
print(f"Battery degradation starts at reading 200")
values_pressure = df_pressure["y"].to_numpy()
first_half_std = np.std(values_pressure[:200])
second_half_std = np.std(values_pressure[200:])
print(f"\nPressure quality:")
print(f" Before battery degradation (readings 0-200):")
print(f" Std: {first_half_std:.2f} hPa")
print(f" After battery degradation (readings 200-400):")
print(f" Std: {second_half_std:.2f} hPa")
print(f" Quality degradation: {((second_half_std/first_half_std - 1) * 100):.1f}% increase in noise")
```
```text theme={null}
Generated 400 pressure readings
Battery degradation starts at reading 200
Pressure quality:
Before battery degradation (readings 0-200):
Std: 0.54 hPa
After battery degradation (readings 200-400):
Std: 29.20 hPa
Quality degradation: 5341.6% increase in noise
```
```python theme={null}
fig, ax = plt.subplots(figsize=(12, 4))
ax.plot(df_pressure["ds"].to_list(), df_pressure["y"].to_list(), alpha=0.8, linewidth=0.7, color="C2")
ax.axvline(x=df_pressure["ds"].to_list()[200], color="red", linestyle="--", alpha=0.5, label="Battery degradation start")
ax.set_xlabel("Timestamp")
ax.set_ylabel("Pressure (hPa)")
ax.set_title("Pressure sensor with battery degradation")
ax.legend()
plt.tight_layout()
plt.show()
```
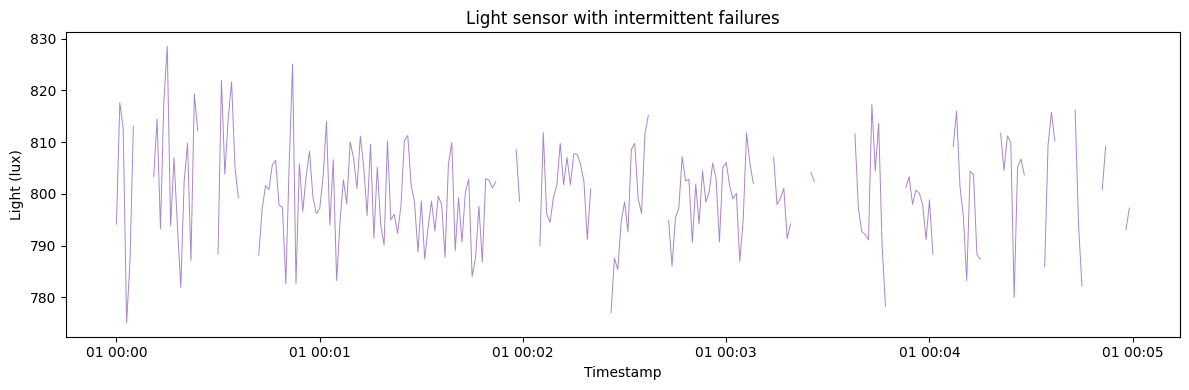
 ## 4. Light sensor with intermittent failures
Simulate a light sensor that experiences random intermittent outages.
```python theme={null}
params_light = {
"min_length": 300,
"max_length": 300,
"freq": "1s",
"n_sensors": 1,
"sensor_type": "light",
"base_value": 800.0,
"measurement_noise": 10.0,
"failure_probability": 0.05,
"failure_type": "intermittent",
"failure_duration": 5,
"seed": 789,
}
gen_light = IoTSensorGenerator(engine="polars", **params_light)
df_light = gen_light.generate(n_series=1)
print(f"Generated {len(df_light)} light readings (1-second intervals)")
values_light = df_light["y"].to_numpy()
nan_count = np.sum(np.isnan(values_light))
valid_count = len(values_light) - nan_count
print(f"\nFailure statistics:")
print(f" Valid readings: {valid_count} ({valid_count/len(values_light)*100:.1f}%)")
print(f" Failed readings: {nan_count} ({nan_count/len(values_light)*100:.1f}%)")
df_light.head(50)
```
```text theme={null}
Generated 300 light readings (1-second intervals)
Failure statistics:
Valid readings: 210 (70.0%)
Failed readings: 90 (30.0%)
```
| unique\_id | ds | y |
| ---------- | ------------------- | ---------- |
| cat | datetime\[ns] | f64 |
| "0" | 2000-01-01 00:00:00 | 794.117333 |
| "0" | 2000-01-01 00:00:01 | 817.596792 |
| "0" | 2000-01-01 00:00:02 | 812.608478 |
| "0" | 2000-01-01 00:00:03 | 775.054655 |
| "0" | 2000-01-01 00:00:04 | 786.852539 |
| … | … | … |
| "0" | 2000-01-01 00:00:45 | 800.829929 |
| "0" | 2000-01-01 00:00:46 | 805.540488 |
| "0" | 2000-01-01 00:00:47 | 806.466231 |
| "0" | 2000-01-01 00:00:48 | 797.781416 |
| "0" | 2000-01-01 00:00:49 | 797.409746 |
```python theme={null}
fig, ax = plt.subplots(figsize=(12, 4))
ax.plot(df_light["ds"].to_list(), df_light["y"].to_list(), alpha=0.8, linewidth=0.7, color="C4")
ax.set_xlabel("Timestamp")
ax.set_ylabel("Light (lux)")
ax.set_title("Light sensor with intermittent failures")
plt.tight_layout()
plt.show()
```
## 4. Light sensor with intermittent failures
Simulate a light sensor that experiences random intermittent outages.
```python theme={null}
params_light = {
"min_length": 300,
"max_length": 300,
"freq": "1s",
"n_sensors": 1,
"sensor_type": "light",
"base_value": 800.0,
"measurement_noise": 10.0,
"failure_probability": 0.05,
"failure_type": "intermittent",
"failure_duration": 5,
"seed": 789,
}
gen_light = IoTSensorGenerator(engine="polars", **params_light)
df_light = gen_light.generate(n_series=1)
print(f"Generated {len(df_light)} light readings (1-second intervals)")
values_light = df_light["y"].to_numpy()
nan_count = np.sum(np.isnan(values_light))
valid_count = len(values_light) - nan_count
print(f"\nFailure statistics:")
print(f" Valid readings: {valid_count} ({valid_count/len(values_light)*100:.1f}%)")
print(f" Failed readings: {nan_count} ({nan_count/len(values_light)*100:.1f}%)")
df_light.head(50)
```
```text theme={null}
Generated 300 light readings (1-second intervals)
Failure statistics:
Valid readings: 210 (70.0%)
Failed readings: 90 (30.0%)
```
| unique\_id | ds | y |
| ---------- | ------------------- | ---------- |
| cat | datetime\[ns] | f64 |
| "0" | 2000-01-01 00:00:00 | 794.117333 |
| "0" | 2000-01-01 00:00:01 | 817.596792 |
| "0" | 2000-01-01 00:00:02 | 812.608478 |
| "0" | 2000-01-01 00:00:03 | 775.054655 |
| "0" | 2000-01-01 00:00:04 | 786.852539 |
| … | … | … |
| "0" | 2000-01-01 00:00:45 | 800.829929 |
| "0" | 2000-01-01 00:00:46 | 805.540488 |
| "0" | 2000-01-01 00:00:47 | 806.466231 |
| "0" | 2000-01-01 00:00:48 | 797.781416 |
| "0" | 2000-01-01 00:00:49 | 797.409746 |
```python theme={null}
fig, ax = plt.subplots(figsize=(12, 4))
ax.plot(df_light["ds"].to_list(), df_light["y"].to_list(), alpha=0.8, linewidth=0.7, color="C4")
ax.set_xlabel("Timestamp")
ax.set_ylabel("Light (lux)")
ax.set_title("Light sensor with intermittent failures")
plt.tight_layout()
plt.show()
```
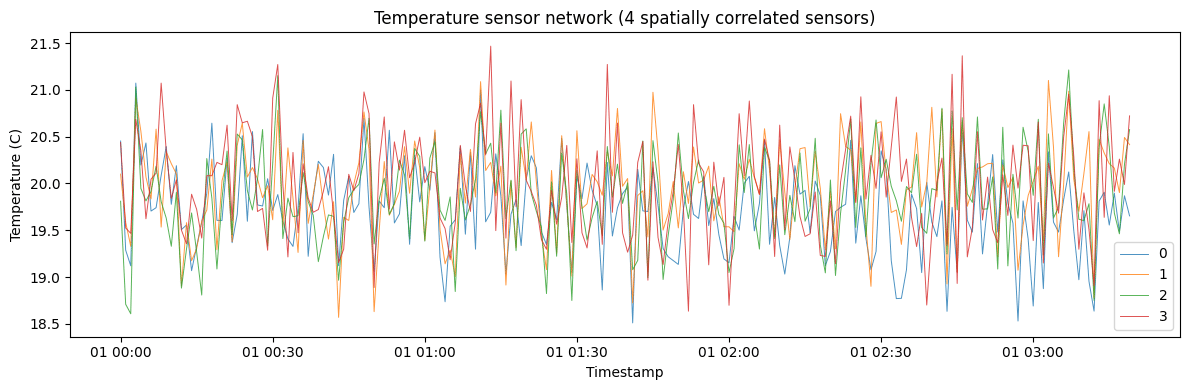
 ## 5. Temperature sensor network (multivariate)
Generate a network of 4 spatially correlated temperature sensors.
```python theme={null}
params_network = {
"min_length": 200,
"max_length": 200,
"freq": "min",
"n_sensors": 4,
"sensor_type": "temperature",
"base_value": 20.0,
"spatial_correlation": 0.7,
"measurement_noise": 0.5,
"seed": 1011,
}
gen_network = IoTSensorGenerator(engine="polars", **params_network)
df_network = gen_network.generate(n_series=1)
print(f"Generated sensor network with {df_network['unique_id'].n_unique()} sensors")
print(f"Total readings: {len(df_network)}")
df_network.head(30)
```
```text theme={null}
Generated sensor network with 4 sensors
Total readings: 800
```
| unique\_id | ds | y |
| ---------- | ------------------- | --------- |
| cat | datetime\[ns] | f64 |
| "0" | 2000-01-01 00:00:00 | 20.452877 |
| "0" | 2000-01-01 00:01:00 | 19.287093 |
| "0" | 2000-01-01 00:02:00 | 19.120498 |
| "0" | 2000-01-01 00:03:00 | 21.071625 |
| "0" | 2000-01-01 00:04:00 | 20.195943 |
| … | … | … |
| "0" | 2000-01-01 00:25:00 | 19.595728 |
| "0" | 2000-01-01 00:26:00 | 20.554394 |
| "0" | 2000-01-01 00:27:00 | 19.770506 |
| "0" | 2000-01-01 00:28:00 | 19.758732 |
| "0" | 2000-01-01 00:29:00 | 20.05044 |
```python theme={null}
fig, ax = plt.subplots(figsize=(12, 4))
for uid in df_network["unique_id"].unique().to_list():
series = df_network.filter(pl.col("unique_id") == uid)
ax.plot(series["ds"].to_list(), series["y"].to_list(), label=uid, alpha=0.8, linewidth=0.7)
ax.set_xlabel("Timestamp")
ax.set_ylabel("Temperature (C)")
ax.set_title("Temperature sensor network (4 spatially correlated sensors)")
ax.legend()
plt.tight_layout()
plt.show()
```
## 5. Temperature sensor network (multivariate)
Generate a network of 4 spatially correlated temperature sensors.
```python theme={null}
params_network = {
"min_length": 200,
"max_length": 200,
"freq": "min",
"n_sensors": 4,
"sensor_type": "temperature",
"base_value": 20.0,
"spatial_correlation": 0.7,
"measurement_noise": 0.5,
"seed": 1011,
}
gen_network = IoTSensorGenerator(engine="polars", **params_network)
df_network = gen_network.generate(n_series=1)
print(f"Generated sensor network with {df_network['unique_id'].n_unique()} sensors")
print(f"Total readings: {len(df_network)}")
df_network.head(30)
```
```text theme={null}
Generated sensor network with 4 sensors
Total readings: 800
```
| unique\_id | ds | y |
| ---------- | ------------------- | --------- |
| cat | datetime\[ns] | f64 |
| "0" | 2000-01-01 00:00:00 | 20.452877 |
| "0" | 2000-01-01 00:01:00 | 19.287093 |
| "0" | 2000-01-01 00:02:00 | 19.120498 |
| "0" | 2000-01-01 00:03:00 | 21.071625 |
| "0" | 2000-01-01 00:04:00 | 20.195943 |
| … | … | … |
| "0" | 2000-01-01 00:25:00 | 19.595728 |
| "0" | 2000-01-01 00:26:00 | 20.554394 |
| "0" | 2000-01-01 00:27:00 | 19.770506 |
| "0" | 2000-01-01 00:28:00 | 19.758732 |
| "0" | 2000-01-01 00:29:00 | 20.05044 |
```python theme={null}
fig, ax = plt.subplots(figsize=(12, 4))
for uid in df_network["unique_id"].unique().to_list():
series = df_network.filter(pl.col("unique_id") == uid)
ax.plot(series["ds"].to_list(), series["y"].to_list(), label=uid, alpha=0.8, linewidth=0.7)
ax.set_xlabel("Timestamp")
ax.set_ylabel("Temperature (C)")
ax.set_title("Temperature sensor network (4 spatially correlated sensors)")
ax.legend()
plt.tight_layout()
plt.show()
```
 ```python theme={null}
sensor_0 = df_network.filter(pl.col("unique_id") == "0")["y"].to_numpy()
sensor_1 = df_network.filter(pl.col("unique_id") == "1")["y"].to_numpy()
sensor_2 = df_network.filter(pl.col("unique_id") == "2")["y"].to_numpy()
sensor_3 = df_network.filter(pl.col("unique_id") == "3")["y"].to_numpy()
corr_01 = np.corrcoef(sensor_0, sensor_1)[0, 1]
corr_12 = np.corrcoef(sensor_1, sensor_2)[0, 1]
corr_23 = np.corrcoef(sensor_2, sensor_3)[0, 1]
corr_03 = np.corrcoef(sensor_0, sensor_3)[0, 1]
print(f"Spatial correlation between sensors:")
print(f" Sensor 0 <-> Sensor 1 (adjacent): {corr_01:.3f}")
print(f" Sensor 1 <-> Sensor 2 (adjacent): {corr_12:.3f}")
print(f" Sensor 2 <-> Sensor 3 (adjacent): {corr_23:.3f}")
print(f" Sensor 0 <-> Sensor 3 (distant): {corr_03:.3f}")
```
```text theme={null}
Spatial correlation between sensors:
Sensor 0 <-> Sensor 1 (adjacent): 0.588
Sensor 1 <-> Sensor 2 (adjacent): 0.683
Sensor 2 <-> Sensor 3 (adjacent): 0.668
Sensor 0 <-> Sensor 3 (distant): 0.338
```
## 6. Motion sensor with complete failure
Simulate a motion sensor that may experience a complete failure, after
which all readings are lost.
```python theme={null}
params_motion = {
"min_length": 200,
"max_length": 200,
"freq": "100ms",
"n_sensors": 1,
"sensor_type": "motion",
"base_value": 0.5,
"measurement_noise": 0.2,
"failure_probability": 0.3,
"failure_type": "complete",
"seed": 1213,
}
gen_motion = IoTSensorGenerator(engine="polars", **params_motion)
df_motion = gen_motion.generate(n_series=1)
print(f"Generated {len(df_motion)} motion sensor readings (100ms intervals)")
values_motion = df_motion["y"].to_numpy()
nan_count_motion = np.sum(np.isnan(values_motion))
if nan_count_motion > 0:
first_nan = np.where(np.isnan(values_motion))[0][0]
print(f"\nSensor failed at reading {first_nan}")
print(f"Valid readings before failure: {first_nan}")
print(f"Failed readings after failure: {nan_count_motion}")
else:
print(f"\nSensor operated normally (no failure occurred)")
```
```text theme={null}
Generated 200 motion sensor readings (100ms intervals)
Sensor failed at reading 0
Valid readings before failure: 0
Failed readings after failure: 200
```
```python theme={null}
fig, ax = plt.subplots(figsize=(12, 4))
ax.plot(df_motion["ds"].to_list(), df_motion["y"].to_list(), alpha=0.8, linewidth=0.7, color="C5")
ax.set_xlabel("Timestamp")
ax.set_ylabel("Motion")
ax.set_title("Motion sensor with complete failure")
plt.tight_layout()
plt.show()
```
```python theme={null}
sensor_0 = df_network.filter(pl.col("unique_id") == "0")["y"].to_numpy()
sensor_1 = df_network.filter(pl.col("unique_id") == "1")["y"].to_numpy()
sensor_2 = df_network.filter(pl.col("unique_id") == "2")["y"].to_numpy()
sensor_3 = df_network.filter(pl.col("unique_id") == "3")["y"].to_numpy()
corr_01 = np.corrcoef(sensor_0, sensor_1)[0, 1]
corr_12 = np.corrcoef(sensor_1, sensor_2)[0, 1]
corr_23 = np.corrcoef(sensor_2, sensor_3)[0, 1]
corr_03 = np.corrcoef(sensor_0, sensor_3)[0, 1]
print(f"Spatial correlation between sensors:")
print(f" Sensor 0 <-> Sensor 1 (adjacent): {corr_01:.3f}")
print(f" Sensor 1 <-> Sensor 2 (adjacent): {corr_12:.3f}")
print(f" Sensor 2 <-> Sensor 3 (adjacent): {corr_23:.3f}")
print(f" Sensor 0 <-> Sensor 3 (distant): {corr_03:.3f}")
```
```text theme={null}
Spatial correlation between sensors:
Sensor 0 <-> Sensor 1 (adjacent): 0.588
Sensor 1 <-> Sensor 2 (adjacent): 0.683
Sensor 2 <-> Sensor 3 (adjacent): 0.668
Sensor 0 <-> Sensor 3 (distant): 0.338
```
## 6. Motion sensor with complete failure
Simulate a motion sensor that may experience a complete failure, after
which all readings are lost.
```python theme={null}
params_motion = {
"min_length": 200,
"max_length": 200,
"freq": "100ms",
"n_sensors": 1,
"sensor_type": "motion",
"base_value": 0.5,
"measurement_noise": 0.2,
"failure_probability": 0.3,
"failure_type": "complete",
"seed": 1213,
}
gen_motion = IoTSensorGenerator(engine="polars", **params_motion)
df_motion = gen_motion.generate(n_series=1)
print(f"Generated {len(df_motion)} motion sensor readings (100ms intervals)")
values_motion = df_motion["y"].to_numpy()
nan_count_motion = np.sum(np.isnan(values_motion))
if nan_count_motion > 0:
first_nan = np.where(np.isnan(values_motion))[0][0]
print(f"\nSensor failed at reading {first_nan}")
print(f"Valid readings before failure: {first_nan}")
print(f"Failed readings after failure: {nan_count_motion}")
else:
print(f"\nSensor operated normally (no failure occurred)")
```
```text theme={null}
Generated 200 motion sensor readings (100ms intervals)
Sensor failed at reading 0
Valid readings before failure: 0
Failed readings after failure: 200
```
```python theme={null}
fig, ax = plt.subplots(figsize=(12, 4))
ax.plot(df_motion["ds"].to_list(), df_motion["y"].to_list(), alpha=0.8, linewidth=0.7, color="C5")
ax.set_xlabel("Timestamp")
ax.set_ylabel("Motion")
ax.set_title("Motion sensor with complete failure")
plt.tight_layout()
plt.show()
```
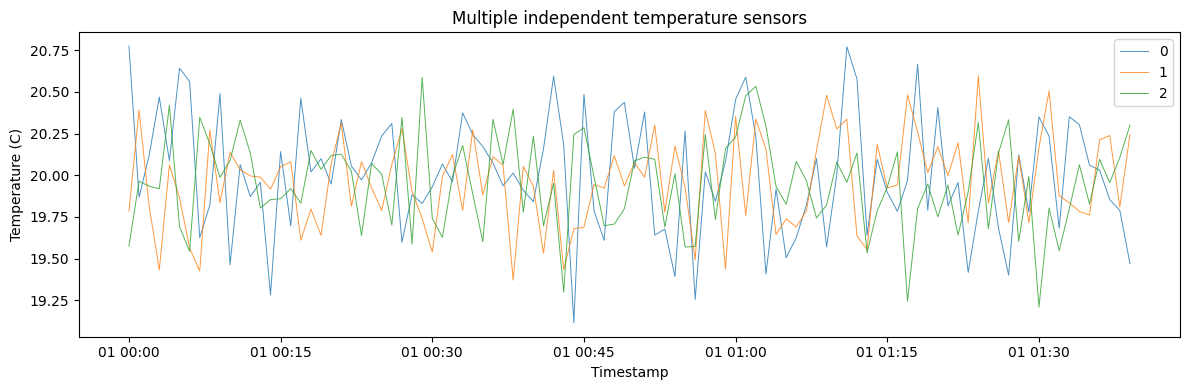
 ## 7. Multiple independent temperature sensors
Generate multiple independent sensors using the univariate mode.
```python theme={null}
params_multi = {
"min_length": 100,
"max_length": 100,
"freq": "min",
"n_sensors": 1,
"sensor_type": "temperature",
"base_value": 20.0,
"measurement_noise": 0.3,
"seed": 1415,
}
gen_multi = IoTSensorGenerator(engine="polars", **params_multi)
df_multi = gen_multi.generate(n_series=3)
print(f"Generated {df_multi['unique_id'].n_unique()} independent sensors")
print(f"\nStatistics per sensor:")
for series_id in df_multi["unique_id"].unique().sort():
series_df = df_multi.filter(pl.col("unique_id") == series_id)
values_series = series_df["y"].to_numpy()
print(
f" {series_id}: Mean={np.mean(values_series):.2f} C, Std={np.std(values_series):.2f} C"
)
```
```text theme={null}
Generated 3 independent sensors
Statistics per sensor:
0: Mean=20.01 C, Std=0.35 C
1: Mean=19.96 C, Std=0.27 C
2: Mean=19.95 C, Std=0.28 C
```
```python theme={null}
fig, ax = plt.subplots(figsize=(12, 4))
for uid in df_multi["unique_id"].unique().to_list():
series = df_multi.filter(pl.col("unique_id") == uid)
ax.plot(series["ds"].to_list(), series["y"].to_list(), label=uid, alpha=0.8, linewidth=0.7)
ax.set_xlabel("Timestamp")
ax.set_ylabel("Temperature (C)")
ax.set_title("Multiple independent temperature sensors")
ax.legend()
plt.tight_layout()
plt.show()
```
## 7. Multiple independent temperature sensors
Generate multiple independent sensors using the univariate mode.
```python theme={null}
params_multi = {
"min_length": 100,
"max_length": 100,
"freq": "min",
"n_sensors": 1,
"sensor_type": "temperature",
"base_value": 20.0,
"measurement_noise": 0.3,
"seed": 1415,
}
gen_multi = IoTSensorGenerator(engine="polars", **params_multi)
df_multi = gen_multi.generate(n_series=3)
print(f"Generated {df_multi['unique_id'].n_unique()} independent sensors")
print(f"\nStatistics per sensor:")
for series_id in df_multi["unique_id"].unique().sort():
series_df = df_multi.filter(pl.col("unique_id") == series_id)
values_series = series_df["y"].to_numpy()
print(
f" {series_id}: Mean={np.mean(values_series):.2f} C, Std={np.std(values_series):.2f} C"
)
```
```text theme={null}
Generated 3 independent sensors
Statistics per sensor:
0: Mean=20.01 C, Std=0.35 C
1: Mean=19.96 C, Std=0.27 C
2: Mean=19.95 C, Std=0.28 C
```
```python theme={null}
fig, ax = plt.subplots(figsize=(12, 4))
for uid in df_multi["unique_id"].unique().to_list():
series = df_multi.filter(pl.col("unique_id") == uid)
ax.plot(series["ds"].to_list(), series["y"].to_list(), label=uid, alpha=0.8, linewidth=0.7)
ax.set_xlabel("Timestamp")
ax.set_ylabel("Temperature (C)")
ax.set_title("Multiple independent temperature sensors")
ax.legend()
plt.tight_layout()
plt.show()
```
 > **Related generators**
>
> * [Anomalies](../../capabilities/anomalies) — inject labelled
> outliers on top of any generator.
> * [Missingness](../../capabilities/missingness) — dropout gaps from
> outages.
>
> Full parameters are in the [generator
> reference](https://github.com/Nixtla/synforecast/blob/main/GENERATORS.md).
> **Related generators**
>
> * [Anomalies](../../capabilities/anomalies) — inject labelled
> outliers on top of any generator.
> * [Missingness](../../capabilities/missingness) — dropout gaps from
> outages.
>
> Full parameters are in the [generator
> reference](https://github.com/Nixtla/synforecast/blob/main/GENERATORS.md).