> ## Documentation Index
> Fetch the complete documentation index at: https://nixtlaverse.nixtla.io/llms.txt
> Use this file to discover all available pages before exploring further.
# Clickstream
Web clickstream data is bursty and sessionized: visits cluster into
sessions, sessions convert at some rate, and traffic ebbs and flows with
time of day and day of week. `ClickstreamGenerator` reproduces these
session and conversion dynamics for web-analytics modeling.
> **The model**
>
> Human sessions per time bin are Poisson-distributed around
> `base_sessions`, modulated by hour-of-day and day-of-week seasonality
> and a slow log-random-walk trend. Bot traffic — a flatter profile with
> occasional crawl spikes — is added on top when `include_bots` is set.
> Pageviews (a geometric page depth for engaged sessions), bounces, and
> conversions are derived from the human sessions, with multipliers set
> by `traffic_source`. `output_type` chooses which of the four series to
> return.
>
> The seasonality assumes hourly data: with `freq='h'` the day/night and
> weekday patterns are correct, and other frequencies distort them.
```python theme={null}
import polars as pl
import matplotlib.pyplot as plt
from synforecast.generators import ClickstreamGenerator
```
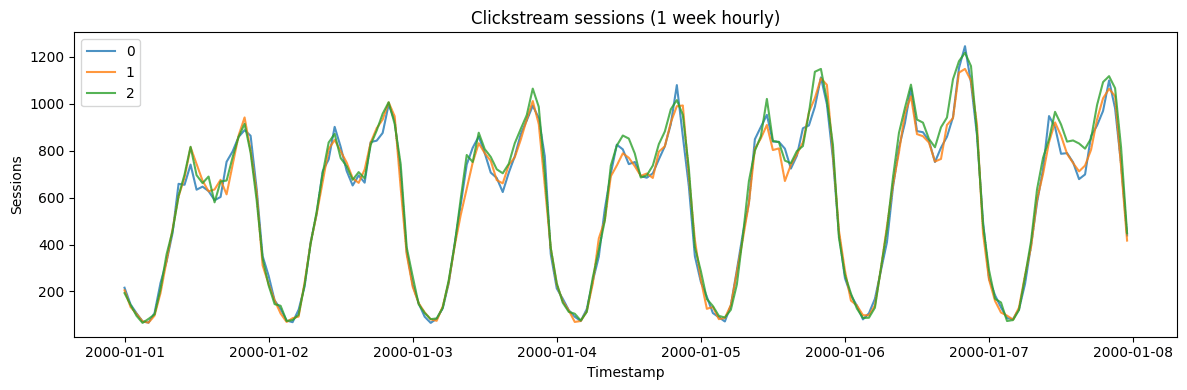
## Session counts (1 week hourly)
Generate hourly session data for 3 series with mixed traffic sources,
bot detection, and conversion tracking.
```python theme={null}
params = {
"min_length": 168,
"max_length": 168,
"freq": "h",
"base_sessions": 500,
"traffic_source": "mixed",
"conversion_rate": 0.03,
"bounce_rate": 0.40,
"include_seasonality": True,
"include_bots": True,
"bot_fraction": 0.15,
"output_type": "sessions",
"seed": 42,
}
generator = ClickstreamGenerator(engine="polars", **params)
df = generator.generate(n_series=3)
print(f"Generated {df['unique_id'].n_unique()} time series")
print(f"Total hourly observations: {len(df)}")
stats = df.group_by("unique_id").agg(
[
pl.col("y").sum().alias("total_sessions"),
pl.col("y").mean().alias("avg_per_hour"),
pl.col("y").max().alias("peak_hour"),
]
)
stats
```
```text theme={null}
Generated 3 time series
Total hourly observations: 504
```
| unique\_id | total\_sessions | avg\_per\_hour | peak\_hour |
| ---------- | --------------- | -------------- | ---------- |
| cat | f64 | f64 | f64 |
| "0" | 97521.0 | 580.482143 | 1246.0 |
| "1" | 97112.0 | 578.047619 | 1149.0 |
| "2" | 100944.0 | 600.857143 | 1218.0 |
```python theme={null}
fig, ax = plt.subplots(figsize=(12, 4))
for uid in df["unique_id"].unique().to_list():
series = df.filter(pl.col("unique_id") == uid)
ax.plot(series["ds"].to_list(), series["y"].to_list(), label=uid, alpha=0.8)
ax.set_xlabel("Timestamp")
ax.set_ylabel("Sessions")
ax.set_title("Clickstream sessions (1 week hourly)")
ax.legend()
plt.tight_layout()
plt.show()
```
 ## Traffic source comparison
Compare conversion rates across different traffic sources: organic,
paid, direct, and referral.
```python theme={null}
sources = ["organic", "paid", "direct", "referral"]
for source in sources:
gen = ClickstreamGenerator(engine="polars",
**{
"min_length": 168,
"max_length": 168,
"freq": "h",
"base_sessions": 500,
"traffic_source": source,
"output_type": "conversions",
"seed": 42,
}
)
source_df = gen.generate(n_series=1)
conv_total = source_df["y"].sum()
gen_sessions = ClickstreamGenerator(engine="polars",
**{
"min_length": 168,
"max_length": 168,
"freq": "h",
"base_sessions": 500,
"traffic_source": source,
"output_type": "sessions",
"seed": 42,
}
)
session_df = gen_sessions.generate(n_series=1)
session_total = session_df["y"].sum()
conv_rate = conv_total / session_total * 100 if session_total > 0 else 0
print(
f"{source:10s}: {session_total:,.0f} sessions, {conv_total:,.0f} conversions ({conv_rate:.2f}%)"
)
```
```text theme={null}
organic : 97,521 sessions, 2,083 conversions (2.14%)
paid : 97,602 sessions, 2,715 conversions (2.78%)
direct : 97,507 sessions, 3,576 conversions (3.67%)
referral : 97,833 sessions, 1,065 conversions (1.09%)
```
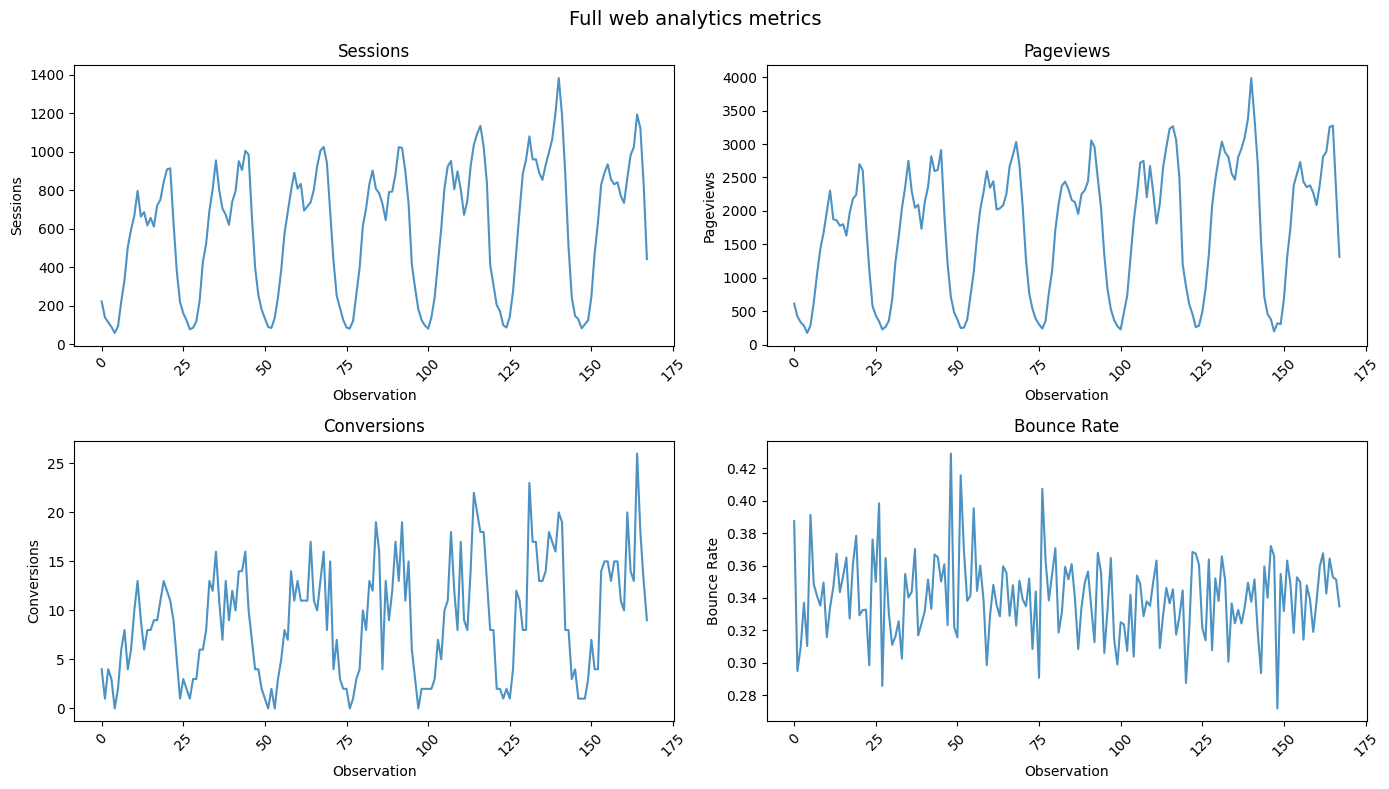
## Complete metrics
Generate a full set of web analytics metrics including sessions,
pageviews, conversions, bounces, and derived rates.
```python theme={null}
full_metrics = generator.generate_full_metrics(n_series=1)
print(f"Total sessions: {full_metrics['sessions'].sum():,.0f}")
print(f"Total pageviews: {full_metrics['pageviews'].sum():,.0f}")
print(f"Total conversions: {full_metrics['conversions'].sum():,.0f}")
print(f"Total bounces: {full_metrics['bounces'].sum():,.0f}")
print(f"Avg bounce rate: {full_metrics['bounce_rate'].mean() * 100:.1f}%")
print(f"Avg conversion rate: {full_metrics['conversion_rate'].mean() * 100:.2f}%")
print(f"Avg pages/session: {full_metrics['pages_per_session'].mean():.2f}")
```
```text theme={null}
Total sessions: 101,797
Total pageviews: 293,073
Total conversions: 1,531
Total bounces: 34,682
Avg bounce rate: 34.1%
Avg conversion rate: 1.52%
Avg pages/session: 2.89
```
```python theme={null}
fig, axes = plt.subplots(2, 2, figsize=(14, 8))
metrics = [("sessions", "Sessions"), ("pageviews", "Pageviews"), ("conversions", "Conversions"), ("bounce_rate", "Bounce Rate")]
for ax, (col, title) in zip(axes.flat, metrics):
ax.plot(full_metrics[col], alpha=0.8)
ax.set_xlabel("Observation")
ax.set_ylabel(title)
ax.set_title(title)
ax.tick_params(axis="x", rotation=45)
plt.suptitle("Full web analytics metrics", fontsize=14)
plt.tight_layout()
plt.show()
```
## Traffic source comparison
Compare conversion rates across different traffic sources: organic,
paid, direct, and referral.
```python theme={null}
sources = ["organic", "paid", "direct", "referral"]
for source in sources:
gen = ClickstreamGenerator(engine="polars",
**{
"min_length": 168,
"max_length": 168,
"freq": "h",
"base_sessions": 500,
"traffic_source": source,
"output_type": "conversions",
"seed": 42,
}
)
source_df = gen.generate(n_series=1)
conv_total = source_df["y"].sum()
gen_sessions = ClickstreamGenerator(engine="polars",
**{
"min_length": 168,
"max_length": 168,
"freq": "h",
"base_sessions": 500,
"traffic_source": source,
"output_type": "sessions",
"seed": 42,
}
)
session_df = gen_sessions.generate(n_series=1)
session_total = session_df["y"].sum()
conv_rate = conv_total / session_total * 100 if session_total > 0 else 0
print(
f"{source:10s}: {session_total:,.0f} sessions, {conv_total:,.0f} conversions ({conv_rate:.2f}%)"
)
```
```text theme={null}
organic : 97,521 sessions, 2,083 conversions (2.14%)
paid : 97,602 sessions, 2,715 conversions (2.78%)
direct : 97,507 sessions, 3,576 conversions (3.67%)
referral : 97,833 sessions, 1,065 conversions (1.09%)
```
## Complete metrics
Generate a full set of web analytics metrics including sessions,
pageviews, conversions, bounces, and derived rates.
```python theme={null}
full_metrics = generator.generate_full_metrics(n_series=1)
print(f"Total sessions: {full_metrics['sessions'].sum():,.0f}")
print(f"Total pageviews: {full_metrics['pageviews'].sum():,.0f}")
print(f"Total conversions: {full_metrics['conversions'].sum():,.0f}")
print(f"Total bounces: {full_metrics['bounces'].sum():,.0f}")
print(f"Avg bounce rate: {full_metrics['bounce_rate'].mean() * 100:.1f}%")
print(f"Avg conversion rate: {full_metrics['conversion_rate'].mean() * 100:.2f}%")
print(f"Avg pages/session: {full_metrics['pages_per_session'].mean():.2f}")
```
```text theme={null}
Total sessions: 101,797
Total pageviews: 293,073
Total conversions: 1,531
Total bounces: 34,682
Avg bounce rate: 34.1%
Avg conversion rate: 1.52%
Avg pages/session: 2.89
```
```python theme={null}
fig, axes = plt.subplots(2, 2, figsize=(14, 8))
metrics = [("sessions", "Sessions"), ("pageviews", "Pageviews"), ("conversions", "Conversions"), ("bounce_rate", "Bounce Rate")]
for ax, (col, title) in zip(axes.flat, metrics):
ax.plot(full_metrics[col], alpha=0.8)
ax.set_xlabel("Observation")
ax.set_ylabel(title)
ax.set_title(title)
ax.tick_params(axis="x", rotation=45)
plt.suptitle("Full web analytics metrics", fontsize=14)
plt.tight_layout()
plt.show()
```
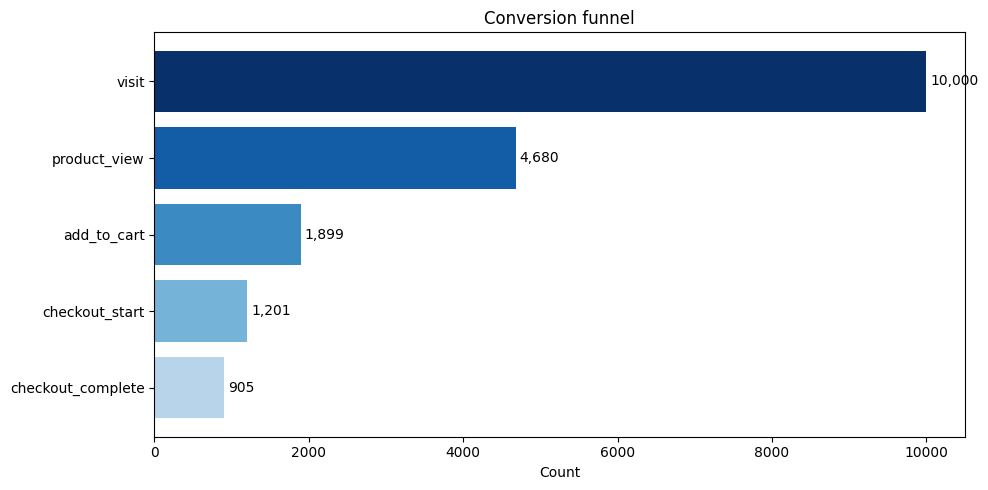
 ## Conversion funnel
Simulate a conversion funnel with 10,000 sessions to see drop-off rates
at each stage.
```python theme={null}
funnel = generator.generate_funnel(n_sessions=10000)
print("Stage | Count | Rate")
print("-" * 45)
prev_count = None
for stage, count in funnel.items():
if prev_count is None:
rate = 100.0
else:
rate = count / prev_count * 100
print(f"{stage:20s} | {count:8,d} | {rate:5.1f}%")
prev_count = count
overall_conv = funnel[list(funnel.keys())[-1]] / funnel["visit"] * 100
print(f"\nOverall funnel conversion: {overall_conv:.2f}%")
```
```text theme={null}
Stage | Count | Rate
---------------------------------------------
visit | 10,000 | 100.0%
product_view | 4,680 | 46.8%
add_to_cart | 1,899 | 40.6%
checkout_start | 1,201 | 63.2%
checkout_complete | 905 | 75.4%
Overall funnel conversion: 9.05%
```
```python theme={null}
fig, ax = plt.subplots(figsize=(10, 5))
stages = list(funnel.keys())
counts = list(funnel.values())
bars = ax.barh(stages[::-1], counts[::-1], color=plt.cm.Blues(
[0.3 + 0.7 * i / (len(stages) - 1) for i in range(len(stages))]
))
for bar, count in zip(bars, counts[::-1]):
ax.text(bar.get_width() + 50, bar.get_y() + bar.get_height() / 2, f"{count:,}", va="center")
ax.set_xlabel("Count")
ax.set_title("Conversion funnel")
plt.tight_layout()
plt.show()
```
## Conversion funnel
Simulate a conversion funnel with 10,000 sessions to see drop-off rates
at each stage.
```python theme={null}
funnel = generator.generate_funnel(n_sessions=10000)
print("Stage | Count | Rate")
print("-" * 45)
prev_count = None
for stage, count in funnel.items():
if prev_count is None:
rate = 100.0
else:
rate = count / prev_count * 100
print(f"{stage:20s} | {count:8,d} | {rate:5.1f}%")
prev_count = count
overall_conv = funnel[list(funnel.keys())[-1]] / funnel["visit"] * 100
print(f"\nOverall funnel conversion: {overall_conv:.2f}%")
```
```text theme={null}
Stage | Count | Rate
---------------------------------------------
visit | 10,000 | 100.0%
product_view | 4,680 | 46.8%
add_to_cart | 1,899 | 40.6%
checkout_start | 1,201 | 63.2%
checkout_complete | 905 | 75.4%
Overall funnel conversion: 9.05%
```
```python theme={null}
fig, ax = plt.subplots(figsize=(10, 5))
stages = list(funnel.keys())
counts = list(funnel.values())
bars = ax.barh(stages[::-1], counts[::-1], color=plt.cm.Blues(
[0.3 + 0.7 * i / (len(stages) - 1) for i in range(len(stages))]
))
for bar, count in zip(bars, counts[::-1]):
ax.text(bar.get_width() + 50, bar.get_y() + bar.get_height() / 2, f"{count:,}", va="center")
ax.set_xlabel("Count")
ax.set_title("Conversion funnel")
plt.tight_layout()
plt.show()
```
 ## Hour-of-day pattern
Analyze the average session count by hour of day over 4 weeks to reveal
the daily traffic pattern.
```python theme={null}
hourly_gen = ClickstreamGenerator(engine="polars",
**{
"min_length": 168 * 4,
"max_length": 168 * 4,
"freq": "h",
"base_sessions": 1000,
"include_seasonality": True,
"include_bots": False,
"seed": 42,
}
)
hourly_df = hourly_gen.generate(n_series=1)
sessions = hourly_df["y"].to_numpy()
hourly_avg = [sessions[i::24].mean() for i in range(24)]
print("Hour | Avg Sessions | Relative")
print("-" * 35)
mean_hourly = sum(hourly_avg) / 24
for hour, avg in enumerate(hourly_avg):
relative = avg / mean_hourly
bar = "*" * int(relative * 10)
print(f" {hour:02d} | {avg:7.1f} | {bar}")
```
```text theme={null}
Hour | Avg Sessions | Relative
-----------------------------------
00 | 364.1 | ****
01 | 247.8 | **
02 | 182.5 | **
03 | 126.5 | *
04 | 125.5 | *
05 | 180.3 | **
06 | 370.1 | ****
07 | 611.0 | ******
08 | 849.5 | *********
09 | 1102.0 | ************
10 | 1209.0 | *************
11 | 1337.9 | ***************
12 | 1216.2 | *************
13 | 1157.9 | *************
14 | 1100.3 | ************
15 | 1047.2 | ***********
16 | 1093.8 | ************
17 | 1217.2 | *************
18 | 1339.8 | ***************
19 | 1470.6 | ****************
20 | 1579.6 | *****************
21 | 1452.0 | ****************
22 | 1090.0 | ************
23 | 615.1 | *******
```
## Model information
Inspect the generator’s configuration and parameters.
```python theme={null}
info = generator.get_model_info()
for key, value in info.items():
if key != "source_params":
print(f"{key}: {value}")
```
```text theme={null}
base_sessions: 500.0
traffic_source: mixed
conversion_rate: 0.03
bounce_rate: 0.4
avg_session_depth: 3.5
include_seasonality: True
include_bots: True
bot_fraction: 0.15
output_type: sessions
```
> **Related generators**
>
> * [Daily active users](daily_active_users) — the aggregate
> engagement metric.
> * [Poisson process](../stochastic/poisson_process) — a baseline
> arrival model.
>
> Full parameters are in the [generator
> reference](https://github.com/Nixtla/synforecast/blob/main/GENERATORS.md).
## Hour-of-day pattern
Analyze the average session count by hour of day over 4 weeks to reveal
the daily traffic pattern.
```python theme={null}
hourly_gen = ClickstreamGenerator(engine="polars",
**{
"min_length": 168 * 4,
"max_length": 168 * 4,
"freq": "h",
"base_sessions": 1000,
"include_seasonality": True,
"include_bots": False,
"seed": 42,
}
)
hourly_df = hourly_gen.generate(n_series=1)
sessions = hourly_df["y"].to_numpy()
hourly_avg = [sessions[i::24].mean() for i in range(24)]
print("Hour | Avg Sessions | Relative")
print("-" * 35)
mean_hourly = sum(hourly_avg) / 24
for hour, avg in enumerate(hourly_avg):
relative = avg / mean_hourly
bar = "*" * int(relative * 10)
print(f" {hour:02d} | {avg:7.1f} | {bar}")
```
```text theme={null}
Hour | Avg Sessions | Relative
-----------------------------------
00 | 364.1 | ****
01 | 247.8 | **
02 | 182.5 | **
03 | 126.5 | *
04 | 125.5 | *
05 | 180.3 | **
06 | 370.1 | ****
07 | 611.0 | ******
08 | 849.5 | *********
09 | 1102.0 | ************
10 | 1209.0 | *************
11 | 1337.9 | ***************
12 | 1216.2 | *************
13 | 1157.9 | *************
14 | 1100.3 | ************
15 | 1047.2 | ***********
16 | 1093.8 | ************
17 | 1217.2 | *************
18 | 1339.8 | ***************
19 | 1470.6 | ****************
20 | 1579.6 | *****************
21 | 1452.0 | ****************
22 | 1090.0 | ************
23 | 615.1 | *******
```
## Model information
Inspect the generator’s configuration and parameters.
```python theme={null}
info = generator.get_model_info()
for key, value in info.items():
if key != "source_params":
print(f"{key}: {value}")
```
```text theme={null}
base_sessions: 500.0
traffic_source: mixed
conversion_rate: 0.03
bounce_rate: 0.4
avg_session_depth: 3.5
include_seasonality: True
include_bots: True
bot_fraction: 0.15
output_type: sessions
```
> **Related generators**
>
> * [Daily active users](daily_active_users) — the aggregate
> engagement metric.
> * [Poisson process](../stochastic/poisson_process) — a baseline
> arrival model.
>
> Full parameters are in the [generator
> reference](https://github.com/Nixtla/synforecast/blob/main/GENERATORS.md).