> ## Documentation Index
> Fetch the complete documentation index at: https://nixtlaverse.nixtla.io/llms.txt
> Use this file to discover all available pages before exploring further.
# Missing data patterns
Real time series arrive with gaps — sensor outages, weekend reporting
holidays, dropped records. SynForecast injects missing values so you can
test imputation and check that a model tolerates gaps rather than
silently mishandling them. Three patterns cover the common shapes.
> **Choosing a pattern**
>
> * `"random"` — points drop independently (transient dropouts).
> * `"block"` — contiguous runs go missing (outages); set
> `missing_block_size`.
> * `"seasonal"` — gaps recur on a cycle (e.g. weekends); set
> `missing_seasonal_period`.
>
> `missing_rate` is the target fraction missing. Missing values appear
> as `NaN` in `y`; the plots below mark them with red ticks along the
> bottom.
```python theme={null}
import matplotlib.pyplot as plt
import polars as pl
from synforecast.generators import RandomWalkGenerator, SeasonalGenerator
def plot_missing(df, title):
"""Plot each series (gaps where missing) and rug-mark missing timestamps."""
fig, ax = plt.subplots(figsize=(11, 4))
for uid in df["unique_id"].unique(maintain_order=True).to_list():
s = df.filter(pl.col("unique_id") == uid).sort("ds")
ax.plot(s["ds"], s["y"], linewidth=1, alpha=0.85, label=str(uid))
missing = df.filter(pl.col("y").is_nan())
if missing.height:
y0 = df["y"].min()
ax.scatter(missing["ds"], [y0] * missing.height, marker="|",
color="crimson", s=40, label="missing")
ax.set(title=title, xlabel="ds", ylabel="y")
ax.legend(fontsize=8)
plt.tight_layout()
plt.show()
def missing_rate(df):
return df["y"].is_nan().mean()
```
## Random gaps
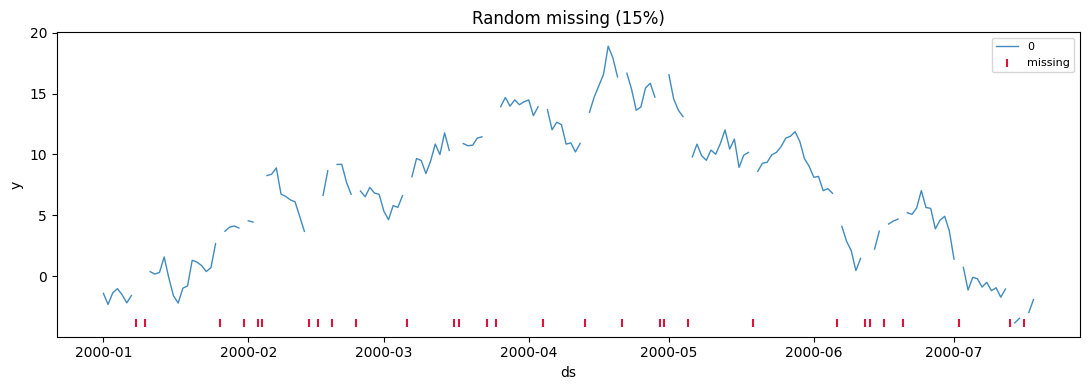
Independent dropouts scattered through the series — the simplest
pattern, and a reasonable default for unreliable feeds.
```python theme={null}
random_df = RandomWalkGenerator(
engine="polars",
min_length=200,
max_length=200,
freq="D",
missing_data=True,
missing_pattern="random",
missing_rate=0.15,
seed=42,
).generate(n_series=1)
print(f"target rate 15%, actual {missing_rate(random_df):.1%}")
plot_missing(random_df, "Random missing (15%)")
```
```text theme={null}
target rate 15%, actual 15.0%
```
 ## Block gaps (outages)
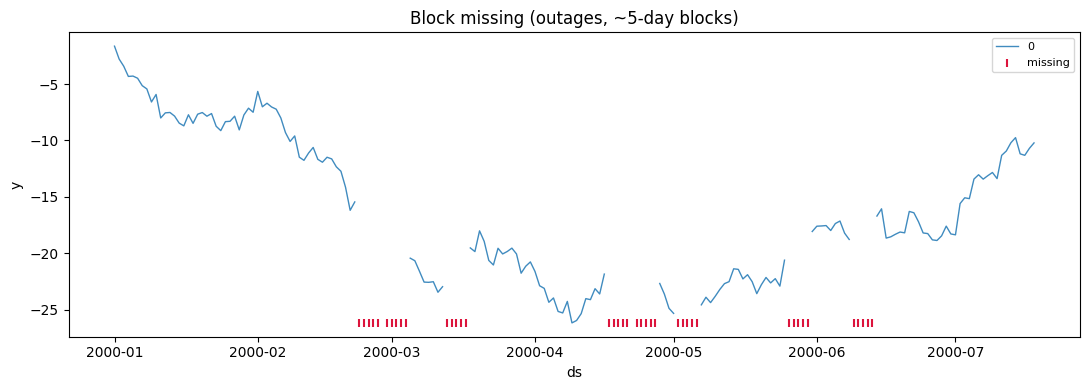
Real outages remove *consecutive* observations. `missing_block_size`
sets the typical run length, so the same overall rate now arrives in a
few long stretches instead of many isolated points.
```python theme={null}
block_df = RandomWalkGenerator(
engine="polars",
min_length=200,
max_length=200,
freq="D",
missing_data=True,
missing_pattern="block",
missing_rate=0.2,
missing_block_size=5,
seed=123,
).generate(n_series=1)
print(f"target rate 20%, actual {missing_rate(block_df):.1%}, block size 5")
plot_missing(block_df, "Block missing (outages, ~5-day blocks)")
```
```text theme={null}
target rate 20%, actual 20.0%, block size 5
```
## Block gaps (outages)
Real outages remove *consecutive* observations. `missing_block_size`
sets the typical run length, so the same overall rate now arrives in a
few long stretches instead of many isolated points.
```python theme={null}
block_df = RandomWalkGenerator(
engine="polars",
min_length=200,
max_length=200,
freq="D",
missing_data=True,
missing_pattern="block",
missing_rate=0.2,
missing_block_size=5,
seed=123,
).generate(n_series=1)
print(f"target rate 20%, actual {missing_rate(block_df):.1%}, block size 5")
plot_missing(block_df, "Block missing (outages, ~5-day blocks)")
```
```text theme={null}
target rate 20%, actual 20.0%, block size 5
```
 ## Seasonal gaps (recurring holidays)
With `missing_pattern="seasonal"` gaps recur on a fixed cycle — the
classic weekend-reporting gap on daily data
(`missing_seasonal_period=7`).
```python theme={null}
seasonal_df = SeasonalGenerator(
engine="polars",
min_length=364,
max_length=364,
freq="D",
seasonality_period=7,
seasonality_amplitude=10.0,
base_level=100.0,
missing_data=True,
missing_pattern="seasonal",
missing_rate=0.12,
missing_seasonal_period=7,
seed=456,
).generate(n_series=1)
print(f"target rate 12%, actual {missing_rate(seasonal_df):.1%}")
plot_missing(seasonal_df.head(84), "Seasonal missing (first 12 weeks)")
```
```text theme={null}
target rate 12%, actual 10.2%
```
## Seasonal gaps (recurring holidays)
With `missing_pattern="seasonal"` gaps recur on a fixed cycle — the
classic weekend-reporting gap on daily data
(`missing_seasonal_period=7`).
```python theme={null}
seasonal_df = SeasonalGenerator(
engine="polars",
min_length=364,
max_length=364,
freq="D",
seasonality_period=7,
seasonality_amplitude=10.0,
base_level=100.0,
missing_data=True,
missing_pattern="seasonal",
missing_rate=0.12,
missing_seasonal_period=7,
seed=456,
).generate(n_series=1)
print(f"target rate 12%, actual {missing_rate(seasonal_df):.1%}")
plot_missing(seasonal_df.head(84), "Seasonal missing (first 12 weeks)")
```
```text theme={null}
target rate 12%, actual 10.2%
```
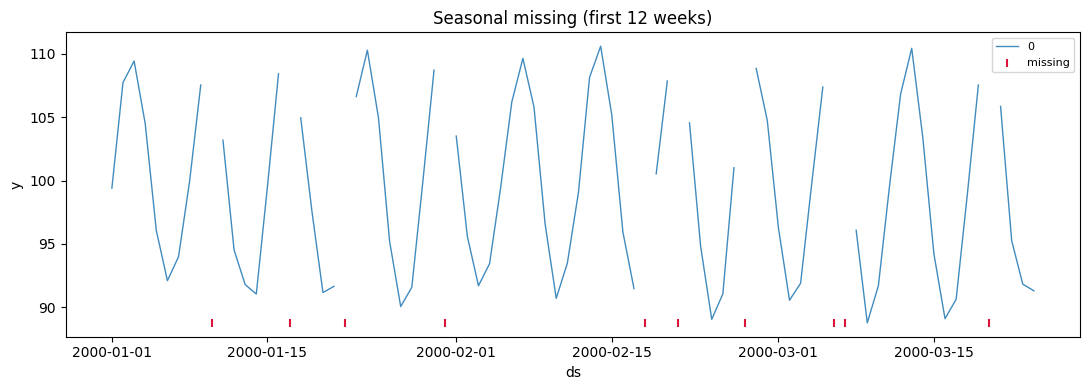 The gaps concentrate on particular days of the week rather than
spreading evenly — the breakdown below makes that concrete.
```python theme={null}
(
seasonal_df.with_columns(
(pl.col("ds").dt.weekday()).alias("weekday"),
pl.col("y").is_nan().alias("is_missing"),
)
.group_by("weekday")
.agg((pl.col("is_missing").mean() * 100).round(1).alias("missing_pct"))
.sort("weekday")
)
```
| weekday | missing\_pct |
| ------- | ------------ |
| i8 | f64 |
| 1 | 26.9 |
| 2 | 9.6 |
| 3 | 7.7 |
| 4 | 0.0 |
| 5 | 5.8 |
| 6 | 7.7 |
| 7 | 13.5 |
## Rate and multiple series
`missing_rate` scales the amount missing, and each series in a panel
gets its own independent gaps.
```python theme={null}
for rate in (0.05, 0.15, 0.30):
df = RandomWalkGenerator(
engine="polars", min_length=300, max_length=300, freq="D",
missing_data=True, missing_pattern="random", missing_rate=rate, seed=789,
).generate(n_series=1)
print(f"target {rate:>4.0%} -> actual {missing_rate(df):.1%}")
multi_df = RandomWalkGenerator(
engine="polars", min_length=100, max_length=100, freq="D",
missing_data=True, missing_pattern="random", missing_rate=0.2, seed=1234,
).generate(n_series=3)
print("\nper-series missing rate:")
print(
multi_df.group_by("unique_id")
.agg((pl.col("y").is_nan().mean() * 100).round(1).alias("missing_pct"))
.sort("unique_id")
)
```
```text theme={null}
target 5% -> actual 5.0%
target 15% -> actual 15.0%
target 30% -> actual 30.0%
per-series missing rate:
shape: (3, 2)
┌───────────┬─────────────┐
│ unique_id ┆ missing_pct │
│ --- ┆ --- │
│ cat ┆ f64 │
╞═══════════╪═════════════╡
│ 0 ┆ 20.0 │
│ 1 ┆ 20.0 │
│ 2 ┆ 20.0 │
└───────────┴─────────────┘
```
> **Related capabilities**
>
> * [Multivariate missingness](multivariate_missingness) — coordinated
> gaps across channels (e.g. a whole sensor dropping out).
> * [Anomalies](anomalies) and [changepoints](changepoints) compose
> with missing data for realistic test series.
The gaps concentrate on particular days of the week rather than
spreading evenly — the breakdown below makes that concrete.
```python theme={null}
(
seasonal_df.with_columns(
(pl.col("ds").dt.weekday()).alias("weekday"),
pl.col("y").is_nan().alias("is_missing"),
)
.group_by("weekday")
.agg((pl.col("is_missing").mean() * 100).round(1).alias("missing_pct"))
.sort("weekday")
)
```
| weekday | missing\_pct |
| ------- | ------------ |
| i8 | f64 |
| 1 | 26.9 |
| 2 | 9.6 |
| 3 | 7.7 |
| 4 | 0.0 |
| 5 | 5.8 |
| 6 | 7.7 |
| 7 | 13.5 |
## Rate and multiple series
`missing_rate` scales the amount missing, and each series in a panel
gets its own independent gaps.
```python theme={null}
for rate in (0.05, 0.15, 0.30):
df = RandomWalkGenerator(
engine="polars", min_length=300, max_length=300, freq="D",
missing_data=True, missing_pattern="random", missing_rate=rate, seed=789,
).generate(n_series=1)
print(f"target {rate:>4.0%} -> actual {missing_rate(df):.1%}")
multi_df = RandomWalkGenerator(
engine="polars", min_length=100, max_length=100, freq="D",
missing_data=True, missing_pattern="random", missing_rate=0.2, seed=1234,
).generate(n_series=3)
print("\nper-series missing rate:")
print(
multi_df.group_by("unique_id")
.agg((pl.col("y").is_nan().mean() * 100).round(1).alias("missing_pct"))
.sort("unique_id")
)
```
```text theme={null}
target 5% -> actual 5.0%
target 15% -> actual 15.0%
target 30% -> actual 30.0%
per-series missing rate:
shape: (3, 2)
┌───────────┬─────────────┐
│ unique_id ┆ missing_pct │
│ --- ┆ --- │
│ cat ┆ f64 │
╞═══════════╪═════════════╡
│ 0 ┆ 20.0 │
│ 1 ┆ 20.0 │
│ 2 ┆ 20.0 │
└───────────┴─────────────┘
```
> **Related capabilities**
>
> * [Multivariate missingness](multivariate_missingness) — coordinated
> gaps across channels (e.g. a whole sensor dropping out).
> * [Anomalies](anomalies) and [changepoints](changepoints) compose
> with missing data for realistic test series.