> ## Documentation Index
> Fetch the complete documentation index at: https://nixtlaverse.nixtla.io/llms.txt
> Use this file to discover all available pages before exploring further.
# Balanced pool
`balanced_pool()` returns 42 pre-configured generator instances, built
from 15 of SynForecast’s 31 generator classes with one class per
behavioral niche. The niches span ARMA and exponential smoothing,
long-range memory, volatility clustering, intermittent demand,
deterministic chaos, counts, and bounded and heavy-tailed processes.
It is the default corpus behind
[`generate_series`](../getting-started/quickstart), and a bias-free
starting point for benchmarking or pretraining: generators are allocated
proportionally to each niche’s behavioral range, so no single domain
dominates the pool. The list is ordered round-robin across the niches,
so any prefix spans as many distinct behaviors as possible: a
`generate_series` panel smaller than the pool still gets one niche per
series.
> **What’s in, and what’s deliberately out**
>
> The pool draws from *interpretable, single-mechanism* generators —
> each slot is one named data-generating process. The meta-generators
> (`TSIGenerator`, `TCMGenerator`, `KernelSynthGenerator`) are excluded
> on purpose: they already randomize across many behaviors internally,
> so folding them in would blur the one-niche-one-mechanism design. Use
> the [`pretraining_pool()`](#pretraining-pool) preset for maximal
> breadth in foundation-model pretraining; it bundles those
> meta-generators, with `balanced_pool` included by default.
```python theme={null}
import matplotlib.pyplot as plt
import polars as pl
from synforecast import SynSet, balanced_pool, pretraining_pool
```
## Generate a balanced dataset
Create 42 generators and generate one series per generator.
```python theme={null}
generators = balanced_pool(
min_length=200, max_length=200, freq="D", seed=42, engine="polars"
)
dataset = SynSet(generators)
df = dataset.generate(n_series_per_generator=1)
print(f"Generators: {len(generators)}")
print(f"Series: {df['unique_id'].n_unique()}")
print(f"Total observations: {len(df)}")
```
```text theme={null}
Generators: 42
Series: 42
Total observations: 8400
```
## Generator names
Each generator has a descriptive name indicating its type and
configuration.
```python theme={null}
for i, gen in enumerate(generators):
print(f" {i}: {gen.alias}")
```
```text theme={null}
0: SARIMAGenerator
1: ETSGenerator
2: FractionalBrownianMotionGenerator
3: RegimeSwitchingGenerator
4: GARCHGenerator
5: CyclicGenerator
6: IntermittentDemandGenerator
7: EnergyLoadGenerator
8: IoTSensorGenerator
9: VitalSignsGenerator
10: GaussianProcessGenerator
11: ChaoticSystemGenerator
12: INARGenerator
13: BoundedProcessGenerator
14: LevyProcessGenerator
15: SARIMAGenerator
16: ETSGenerator
17: FractionalBrownianMotionGenerator
18: RegimeSwitchingGenerator
19: GARCHGenerator
20: CyclicGenerator
21: IntermittentDemandGenerator
22: EnergyLoadGenerator
23: IoTSensorGenerator
24: VitalSignsGenerator
25: GaussianProcessGenerator
26: ChaoticSystemGenerator
27: INARGenerator
28: BoundedProcessGenerator
29: LevyProcessGenerator
30: SARIMAGenerator
31: ETSGenerator
32: FractionalBrownianMotionGenerator
33: IntermittentDemandGenerator
34: IoTSensorGenerator
35: VitalSignsGenerator
36: GaussianProcessGenerator
37: ChaoticSystemGenerator
38: SARIMAGenerator
39: ETSGenerator
40: GaussianProcessGenerator
41: SARIMAGenerator
```
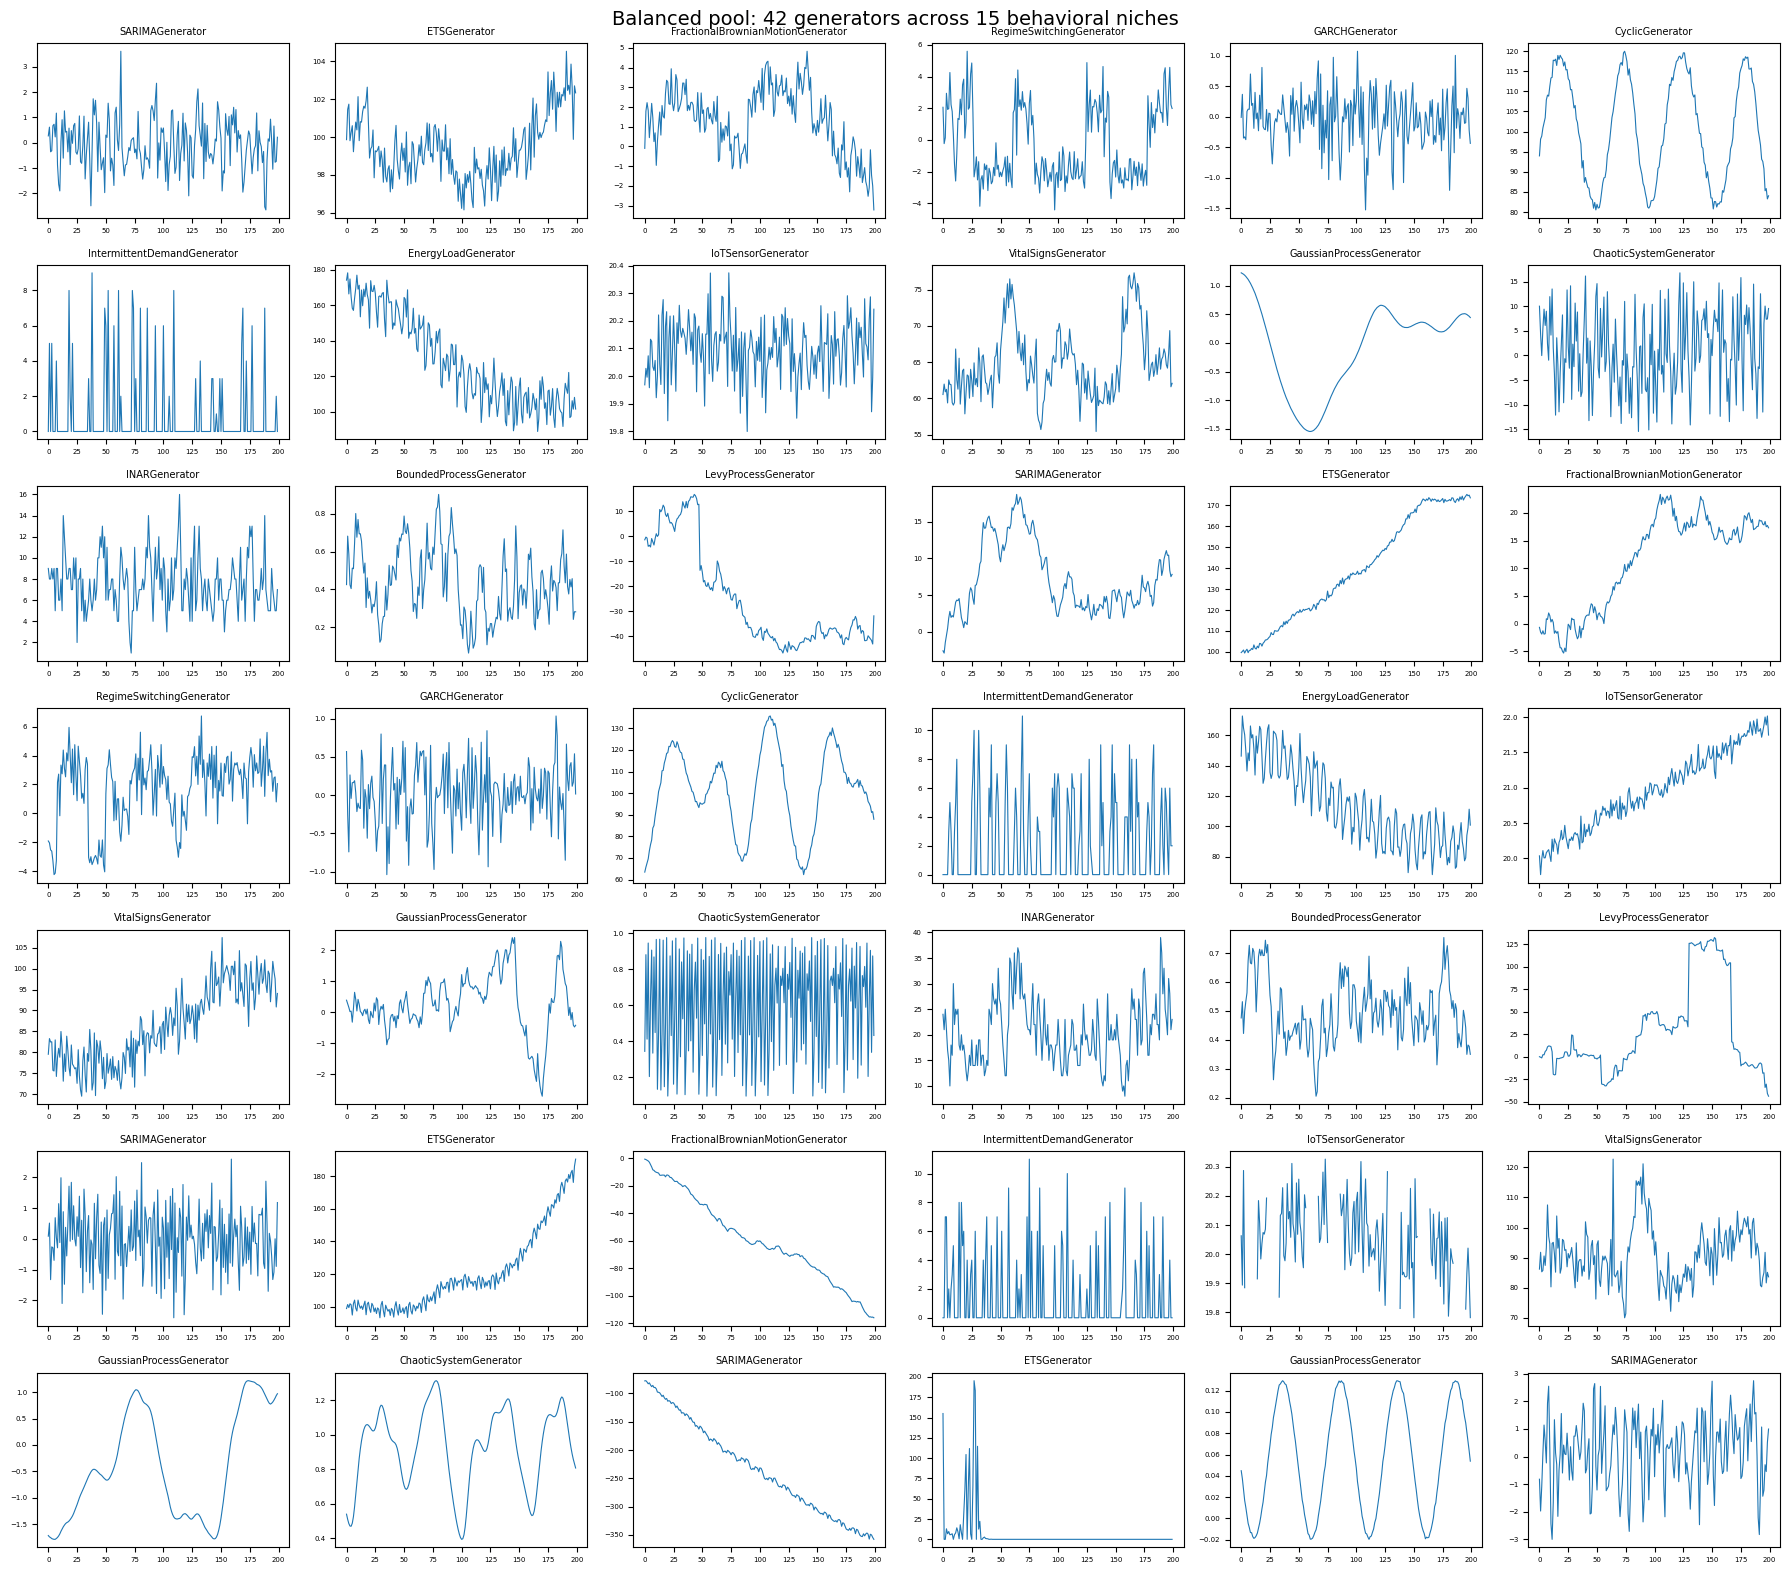
## Overview: all 42 series
A compact grid showing every series in the balanced pool.
```python theme={null}
fig, axes = plt.subplots(7, 6, figsize=(18, 16))
axes = axes.flatten()
for i, gen in enumerate(generators):
uid = str(i)
series = df.filter(pl.col("unique_id") == uid)
values = series["y"].to_list()
axes[i].plot(values, linewidth=0.8)
axes[i].set_title(gen.alias, fontsize=7)
axes[i].tick_params(labelsize=5)
fig.suptitle("Balanced pool: 42 generators across 15 behavioral niches", fontsize=14)
plt.tight_layout()
plt.show()
```
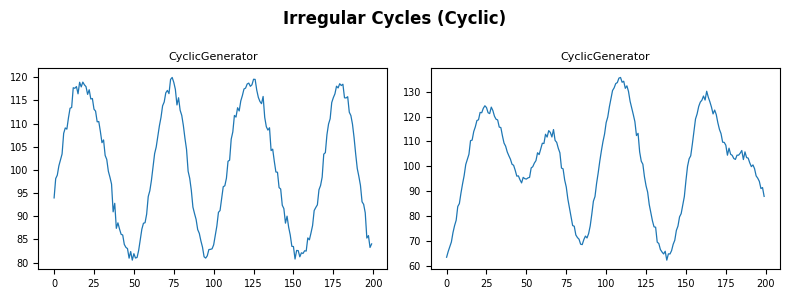
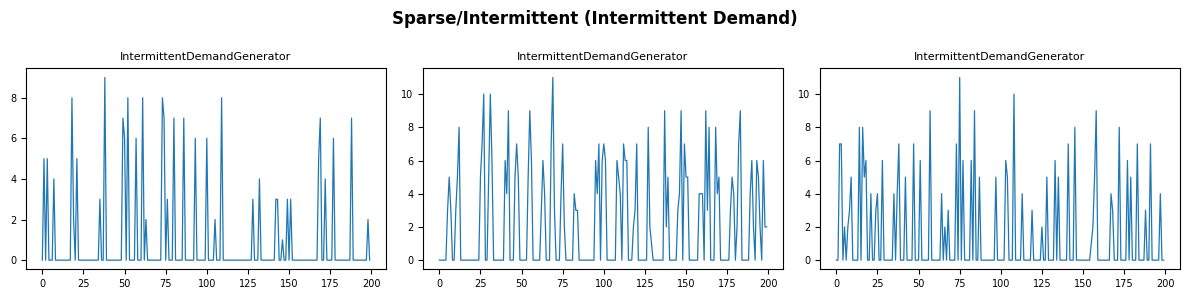
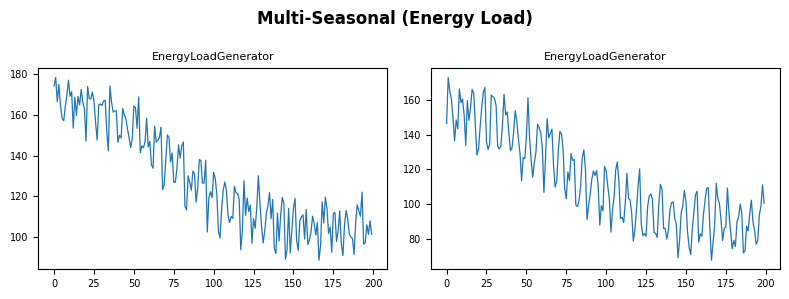
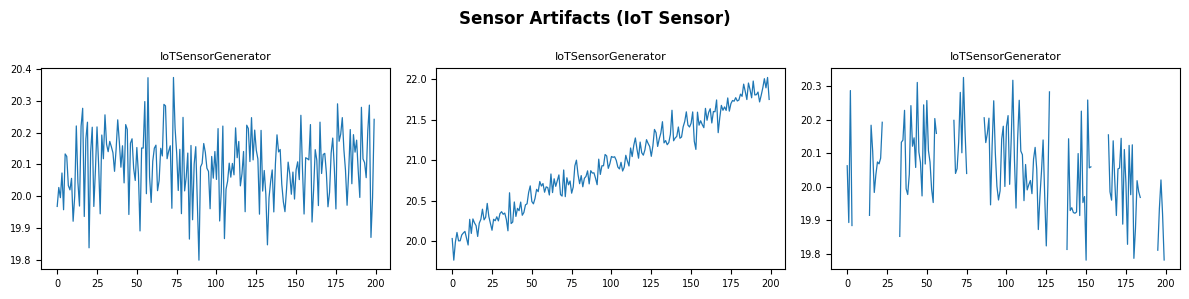
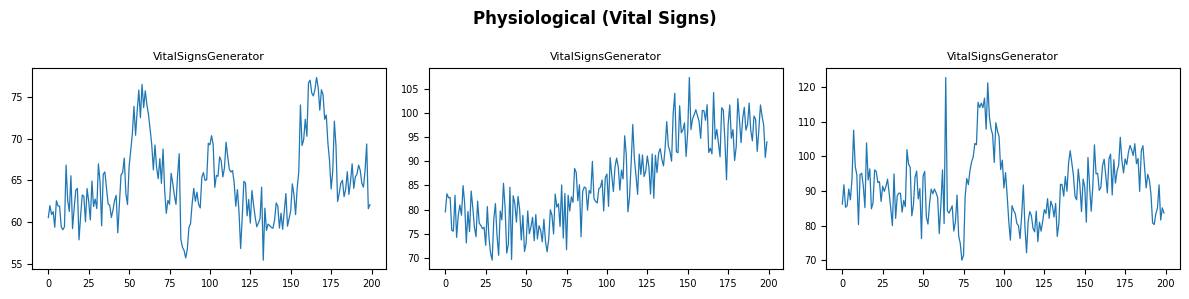
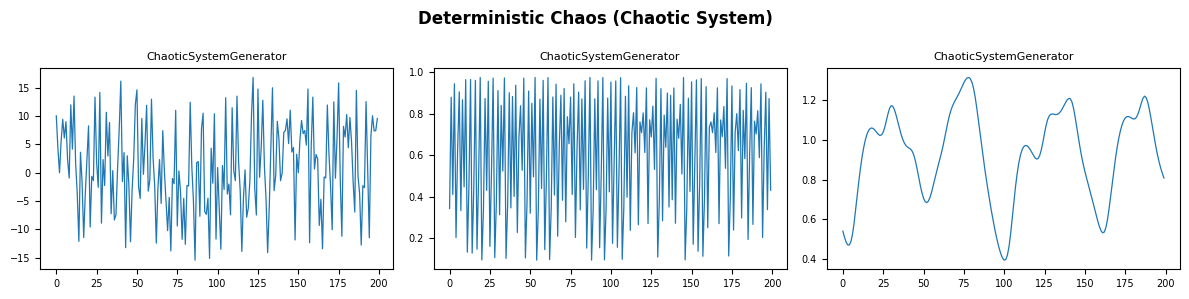
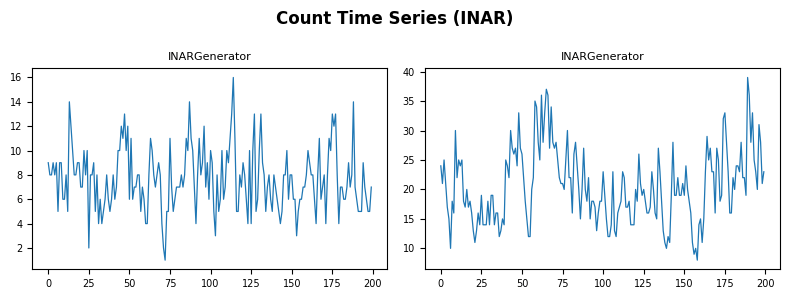
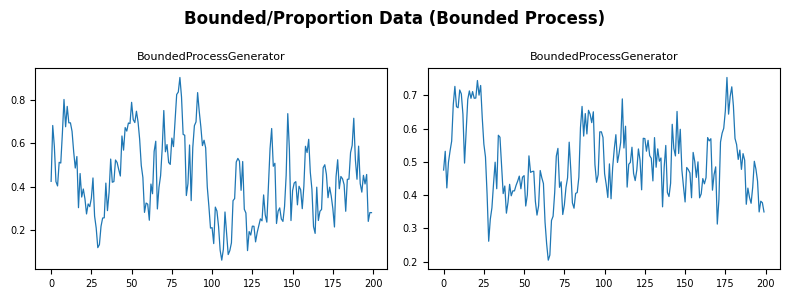
 ## Niche deep-dives
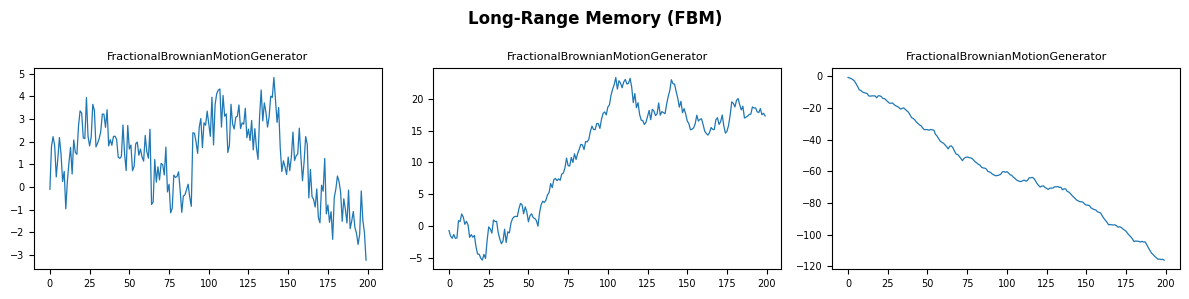
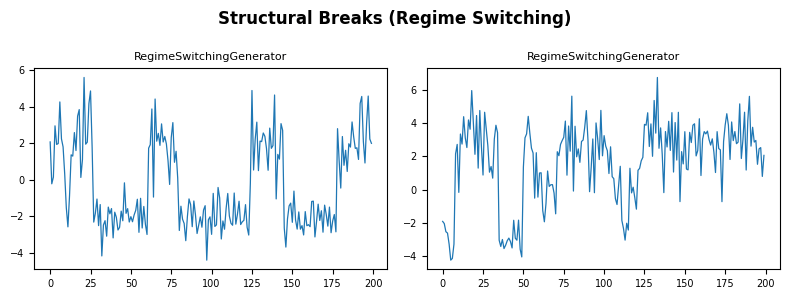
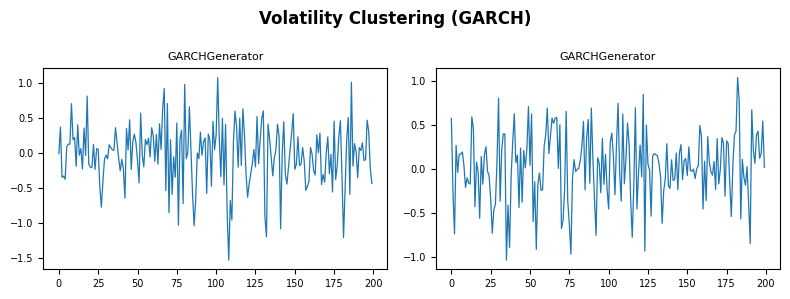
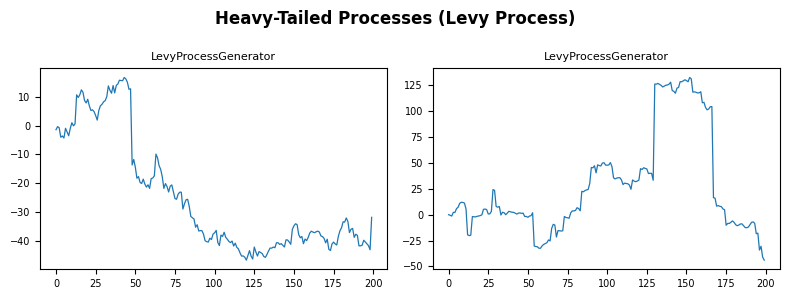
Each behavioral niche contributes a different number of generators.
Below we group them by niche and plot the variants side by side.
```python theme={null}
niche_labels = [
("ARMA + Seasonality (SARIMA)", "SARIMAGenerator"),
("Exponential Smoothing (ETS)", "ETSGenerator"),
("Long-Range Memory (FBM)", "FractionalBrownianMotionGenerator"),
("Structural Breaks (Regime Switching)", "RegimeSwitchingGenerator"),
("Volatility Clustering (GARCH)", "GARCHGenerator"),
("Irregular Cycles (Cyclic)", "CyclicGenerator"),
("Sparse/Intermittent (Intermittent Demand)", "IntermittentDemandGenerator"),
("Multi-Seasonal (Energy Load)", "EnergyLoadGenerator"),
("Sensor Artifacts (IoT Sensor)", "IoTSensorGenerator"),
("Physiological (Vital Signs)", "VitalSignsGenerator"),
("Smooth/Rough Functions (Gaussian Process)", "GaussianProcessGenerator"),
("Deterministic Chaos (Chaotic System)", "ChaoticSystemGenerator"),
("Count Time Series (INAR)", "INARGenerator"),
("Bounded/Proportion Data (Bounded Process)", "BoundedProcessGenerator"),
("Heavy-Tailed Processes (Levy Process)", "LevyProcessGenerator"),
]
# The pool is interleaved across niches, so look indices up by class
# rather than assuming contiguous blocks.
niches = [
(label, [i for i, g in enumerate(generators) if type(g).__name__ == cls])
for label, cls in niche_labels
]
```
```python theme={null}
for niche_name, indices in niches:
n = len(indices)
fig, axes = plt.subplots(1, n, figsize=(4 * n, 3), squeeze=False)
fig.suptitle(niche_name, fontsize=12, fontweight="bold")
for j, idx in enumerate(indices):
uid = str(idx)
series = df.filter(pl.col("unique_id") == uid)
axes[0][j].plot(series["y"].to_list(), linewidth=0.9)
axes[0][j].set_title(generators[idx].alias, fontsize=8)
axes[0][j].tick_params(labelsize=7)
plt.tight_layout()
plt.show()
```
## Niche deep-dives
Each behavioral niche contributes a different number of generators.
Below we group them by niche and plot the variants side by side.
```python theme={null}
niche_labels = [
("ARMA + Seasonality (SARIMA)", "SARIMAGenerator"),
("Exponential Smoothing (ETS)", "ETSGenerator"),
("Long-Range Memory (FBM)", "FractionalBrownianMotionGenerator"),
("Structural Breaks (Regime Switching)", "RegimeSwitchingGenerator"),
("Volatility Clustering (GARCH)", "GARCHGenerator"),
("Irregular Cycles (Cyclic)", "CyclicGenerator"),
("Sparse/Intermittent (Intermittent Demand)", "IntermittentDemandGenerator"),
("Multi-Seasonal (Energy Load)", "EnergyLoadGenerator"),
("Sensor Artifacts (IoT Sensor)", "IoTSensorGenerator"),
("Physiological (Vital Signs)", "VitalSignsGenerator"),
("Smooth/Rough Functions (Gaussian Process)", "GaussianProcessGenerator"),
("Deterministic Chaos (Chaotic System)", "ChaoticSystemGenerator"),
("Count Time Series (INAR)", "INARGenerator"),
("Bounded/Proportion Data (Bounded Process)", "BoundedProcessGenerator"),
("Heavy-Tailed Processes (Levy Process)", "LevyProcessGenerator"),
]
# The pool is interleaved across niches, so look indices up by class
# rather than assuming contiguous blocks.
niches = [
(label, [i for i, g in enumerate(generators) if type(g).__name__ == cls])
for label, cls in niche_labels
]
```
```python theme={null}
for niche_name, indices in niches:
n = len(indices)
fig, axes = plt.subplots(1, n, figsize=(4 * n, 3), squeeze=False)
fig.suptitle(niche_name, fontsize=12, fontweight="bold")
for j, idx in enumerate(indices):
uid = str(idx)
series = df.filter(pl.col("unique_id") == uid)
axes[0][j].plot(series["y"].to_list(), linewidth=0.9)
axes[0][j].set_title(generators[idx].alias, fontsize=8)
axes[0][j].tick_params(labelsize=7)
plt.tight_layout()
plt.show()
```



 ## Summary statistics
Compare key statistics across all 42 series to see how the balanced pool
spans different value ranges and variabilities.
```python theme={null}
stats = (
df.group_by("unique_id")
.agg(
[
pl.col("y").count().alias("count"),
pl.col("y").min().alias("min"),
pl.col("y").max().alias("max"),
pl.col("y").mean().alias("mean"),
pl.col("y").std().alias("std"),
]
)
.sort("unique_id")
)
stats
```
| unique\_id | count | min | max | mean | std |
| ---------- | ----- | --------- | ---------- | ---------- | --------- |
| cat | u32 | f64 | f64 | f64 | f64 |
| "0" | 200 | -2.652759 | 3.609343 | -0.068571 | 0.99059 |
| "1" | 200 | 96.138073 | 104.540914 | 99.457374 | 1.680738 |
| "10" | 200 | -1.549691 | 1.22711 | -0.083459 | 0.761829 |
| "11" | 200 | -15.4612 | 16.7784 | 0.983599 | 7.871835 |
| "12" | 200 | 1.0 | 16.0 | 7.64 | 2.544163 |
| … | … | … | … | … | … |
| "5" | 200 | 80.533159 | 119.965854 | 101.125541 | 12.976649 |
| "6" | 200 | 0.0 | 9.0 | 0.915 | 2.168244 |
| "7" | 200 | 88.836529 | 178.20318 | 129.009721 | 25.104989 |
| "8" | 200 | 19.799144 | 20.373597 | 20.096759 | 0.105014 |
| "9" | 200 | 55.425593 | 77.339503 | 64.864145 | 4.815145 |
## Scaling up
Generate multiple series per generator for a larger dataset.
```python theme={null}
df_large = dataset.generate(n_series_per_generator=5)
print(f"Series: {df_large['unique_id'].n_unique()}")
print(f"Total observations: {len(df_large)}")
```
```text theme={null}
Series: 210
Total observations: 42000
```
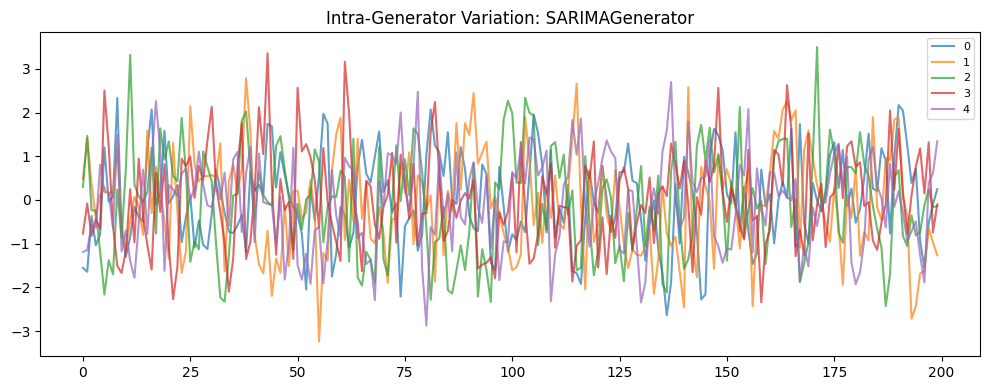
Plot five series from a single generator to see intra-generator
variation.
```python theme={null}
fig, ax = plt.subplots(figsize=(10, 4))
# SynSet assigns ids per generator in pool order, so series 0-4 come
# from generators[0]: the SARIMAGenerator configured as a stationary AR(1)
for sid in range(5):
uid = str(sid)
series = df_large.filter(pl.col("unique_id") == uid)
ax.plot(series["y"].to_list(), alpha=0.7, label=uid)
ax.set_title(f"Intra-Generator Variation: {generators[0].alias}")
ax.legend(fontsize=8)
plt.tight_layout()
plt.show()
```
## Summary statistics
Compare key statistics across all 42 series to see how the balanced pool
spans different value ranges and variabilities.
```python theme={null}
stats = (
df.group_by("unique_id")
.agg(
[
pl.col("y").count().alias("count"),
pl.col("y").min().alias("min"),
pl.col("y").max().alias("max"),
pl.col("y").mean().alias("mean"),
pl.col("y").std().alias("std"),
]
)
.sort("unique_id")
)
stats
```
| unique\_id | count | min | max | mean | std |
| ---------- | ----- | --------- | ---------- | ---------- | --------- |
| cat | u32 | f64 | f64 | f64 | f64 |
| "0" | 200 | -2.652759 | 3.609343 | -0.068571 | 0.99059 |
| "1" | 200 | 96.138073 | 104.540914 | 99.457374 | 1.680738 |
| "10" | 200 | -1.549691 | 1.22711 | -0.083459 | 0.761829 |
| "11" | 200 | -15.4612 | 16.7784 | 0.983599 | 7.871835 |
| "12" | 200 | 1.0 | 16.0 | 7.64 | 2.544163 |
| … | … | … | … | … | … |
| "5" | 200 | 80.533159 | 119.965854 | 101.125541 | 12.976649 |
| "6" | 200 | 0.0 | 9.0 | 0.915 | 2.168244 |
| "7" | 200 | 88.836529 | 178.20318 | 129.009721 | 25.104989 |
| "8" | 200 | 19.799144 | 20.373597 | 20.096759 | 0.105014 |
| "9" | 200 | 55.425593 | 77.339503 | 64.864145 | 4.815145 |
## Scaling up
Generate multiple series per generator for a larger dataset.
```python theme={null}
df_large = dataset.generate(n_series_per_generator=5)
print(f"Series: {df_large['unique_id'].n_unique()}")
print(f"Total observations: {len(df_large)}")
```
```text theme={null}
Series: 210
Total observations: 42000
```
Plot five series from a single generator to see intra-generator
variation.
```python theme={null}
fig, ax = plt.subplots(figsize=(10, 4))
# SynSet assigns ids per generator in pool order, so series 0-4 come
# from generators[0]: the SARIMAGenerator configured as a stationary AR(1)
for sid in range(5):
uid = str(sid)
series = df_large.filter(pl.col("unique_id") == uid)
ax.plot(series["y"].to_list(), alpha=0.7, label=uid)
ax.set_title(f"Intra-Generator Variation: {generators[0].alias}")
ax.legend(fontsize=8)
plt.tight_layout()
plt.show()
```
 ## Pretraining pool
`pretraining_pool()` is the breadth-maximizing counterpart to
`balanced_pool()`. It keeps the 42 single-mechanism instances above and
adds independently-seeded copies of the three meta-generators
`balanced_pool` deliberately leaves out — `TSIGenerator`,
`TCMGenerator`, and `KernelSynthGenerator`. Each of those resamples a
fresh trend/seasonal, causal-graph, or GP-kernel configuration per
series, so a handful of instances already spans a very wide distribution
— the goal when pretraining a foundation model rather than benchmarking
one named process. The default length range is wider too (256-1024
steps), matching typical pretraining contexts.
Two knobs control the mix: `n_meta_variants` sets how many
independently-seeded copies of each meta-generator to add (default 3),
and `include_balanced=False` drops the single-mechanism generators for a
purely procedural corpus.
```python theme={null}
pretrain = pretraining_pool(
min_length=256, max_length=256, freq="D", seed=42, engine="polars"
)
meta_only = pretraining_pool(include_balanced=False, engine="polars")
from collections import Counter
print(f"pretraining_pool: {len(pretrain)} generators")
print(f" {len(pretrain) - len(meta_only)} single-mechanism (from balanced_pool)")
print(f" {len(meta_only)} meta-generator instances")
print(" meta-generators:", dict(Counter(type(g).__name__ for g in meta_only)))
```
```text theme={null}
pretraining_pool: 51 generators
42 single-mechanism (from balanced_pool)
9 meta-generator instances
meta-generators: {'TSIGenerator': 3, 'TCMGenerator': 3, 'KernelSynthGenerator': 3}
```
```python theme={null}
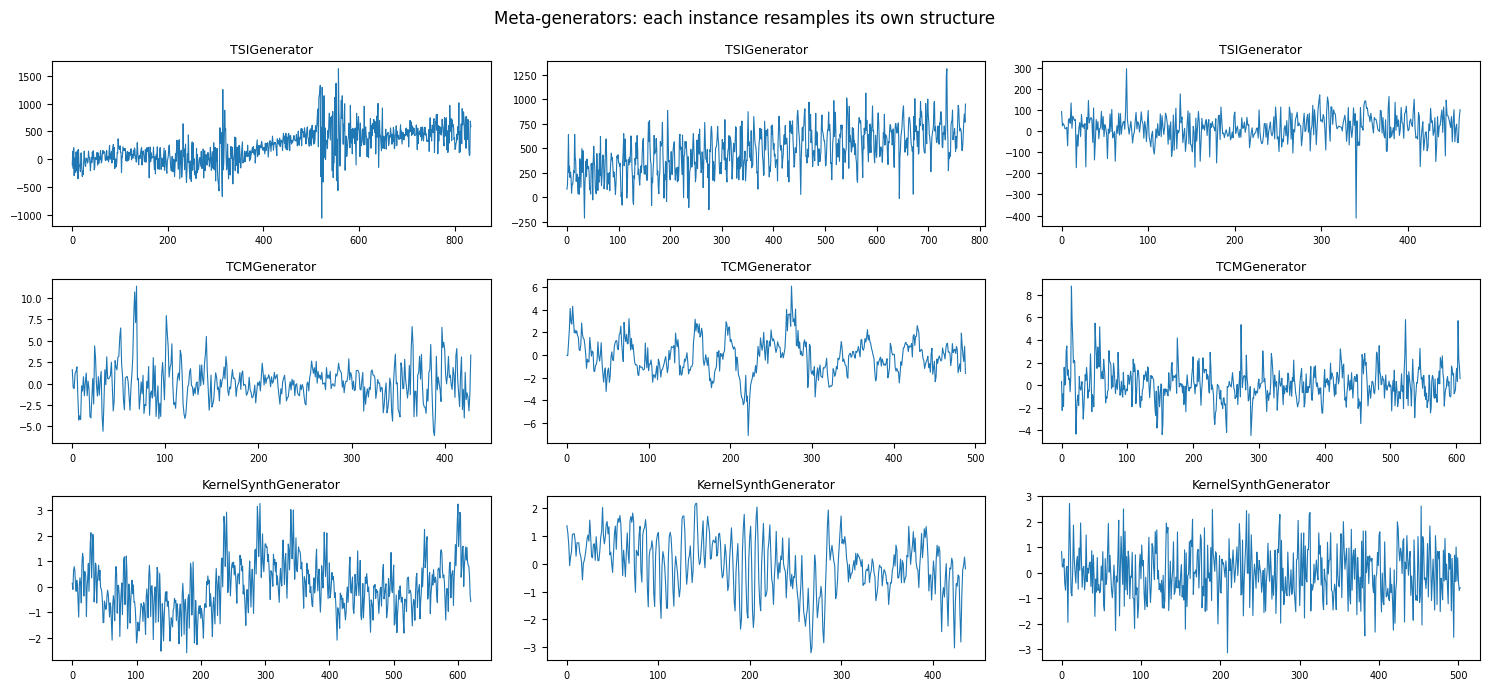
# Each meta-generator instance draws its own structure, so even nine series
# span trends, seasonality, causal dynamics, and kernel-sampled shapes.
meta_df = SynSet(meta_only).generate(n_series_per_generator=1)
fig, axes = plt.subplots(3, 3, figsize=(15, 7))
for ax, (uid, gen) in zip(axes.ravel(), enumerate(meta_only)):
series = meta_df.filter(pl.col("unique_id") == str(uid))
ax.plot(series["y"].to_list(), linewidth=0.8)
ax.set_title(type(gen).__name__, fontsize=9)
ax.tick_params(labelsize=7)
fig.suptitle("Meta-generators: each instance resamples its own structure")
plt.tight_layout()
plt.show()
```
## Pretraining pool
`pretraining_pool()` is the breadth-maximizing counterpart to
`balanced_pool()`. It keeps the 42 single-mechanism instances above and
adds independently-seeded copies of the three meta-generators
`balanced_pool` deliberately leaves out — `TSIGenerator`,
`TCMGenerator`, and `KernelSynthGenerator`. Each of those resamples a
fresh trend/seasonal, causal-graph, or GP-kernel configuration per
series, so a handful of instances already spans a very wide distribution
— the goal when pretraining a foundation model rather than benchmarking
one named process. The default length range is wider too (256-1024
steps), matching typical pretraining contexts.
Two knobs control the mix: `n_meta_variants` sets how many
independently-seeded copies of each meta-generator to add (default 3),
and `include_balanced=False` drops the single-mechanism generators for a
purely procedural corpus.
```python theme={null}
pretrain = pretraining_pool(
min_length=256, max_length=256, freq="D", seed=42, engine="polars"
)
meta_only = pretraining_pool(include_balanced=False, engine="polars")
from collections import Counter
print(f"pretraining_pool: {len(pretrain)} generators")
print(f" {len(pretrain) - len(meta_only)} single-mechanism (from balanced_pool)")
print(f" {len(meta_only)} meta-generator instances")
print(" meta-generators:", dict(Counter(type(g).__name__ for g in meta_only)))
```
```text theme={null}
pretraining_pool: 51 generators
42 single-mechanism (from balanced_pool)
9 meta-generator instances
meta-generators: {'TSIGenerator': 3, 'TCMGenerator': 3, 'KernelSynthGenerator': 3}
```
```python theme={null}
# Each meta-generator instance draws its own structure, so even nine series
# span trends, seasonality, causal dynamics, and kernel-sampled shapes.
meta_df = SynSet(meta_only).generate(n_series_per_generator=1)
fig, axes = plt.subplots(3, 3, figsize=(15, 7))
for ax, (uid, gen) in zip(axes.ravel(), enumerate(meta_only)):
series = meta_df.filter(pl.col("unique_id") == str(uid))
ax.plot(series["y"].to_list(), linewidth=0.8)
ax.set_title(type(gen).__name__, fontsize=9)
ax.tick_params(labelsize=7)
fig.suptitle("Meta-generators: each instance resamples its own structure")
plt.tight_layout()
plt.show()
```
 Whether pretraining on a synthetic corpus like this actually helps
depends on the target data and the amount of real history available. See
[when synthetic data helps](when_synthetic_helps) for a paired,
multi-seed benchmark that reports where it wins, where it is neutral,
and where the edge reverses.
Whether pretraining on a synthetic corpus like this actually helps
depends on the target data and the amount of real history available. See
[when synthetic data helps](when_synthetic_helps) for a paired,
multi-seed benchmark that reports where it wins, where it is neutral,
and where the edge reverses.