> ## Documentation Index
> Fetch the complete documentation index at: https://nixtlaverse.nixtla.io/llms.txt
> Use this file to discover all available pages before exploring further.
# Data augmentation with real datasets
This example augments real M4 time series with `SynAugment` and shows
what the augmentation actually guarantees.
`SynAugment` fits a generator to each input series, draws new series
from it, and then rescales every synthetic draw to the source series’
**mean**, **standard deviation**, and **lag-1 autocorrelation**. Those
three statistics therefore match *by construction* — reporting them back
as “close to the original” would only measure the rescaling step, not
the quality of the augmentation.
So instead of a fidelity table dominated by matched-by-design
statistics, this page reports two things the rescaling does not
determine:
1. **Whether the synthetic series are new draws rather than
near-copies.** We check the correlation between each synthetic
series and its source.
2. **How the unpinned properties behave** — the distribution shape
(min, max, skewness), which is free to vary and shows how much the
synthetic draws explore around the target moments.
**Requires**: `datasetsforecast` (`pip install datasetsforecast`)
```python theme={null}
import tempfile
import matplotlib.pyplot as plt
import numpy as np
import polars as pl
from datasetsforecast.m4 import M4
from synforecast import SynAugment
```
```python theme={null}
def compute_series_stats(values: np.ndarray) -> dict:
"""Compute statistical properties of a time series."""
return {
"mean": float(np.mean(values)),
"std": float(np.std(values)),
"min": float(np.min(values)),
"max": float(np.max(values)),
"range": float(np.max(values) - np.min(values)),
"cv": float(np.std(values) / np.mean(values)) if np.mean(values) != 0 else 0,
"skewness": float(np.mean(((values - np.mean(values)) / np.std(values)) ** 3))
if np.std(values) > 0
else 0,
"autocorr_lag1": float(np.corrcoef(values[:-1], values[1:])[0, 1])
if len(values) > 1
else 0,
}
# Statistics SynAugment matches to the source series by construction (via the
# rescaling step in SynAugment._match_autocorrelation). A small difference here
# is expected and is not evidence of augmentation quality.
PINNED_STATS = {"mean", "std", "cv", "autocorr_lag1"}
def print_comparison_table(original_stats: dict, synthetic_stats_list: list) -> None:
"""Print a comparison table of original vs synthetic statistics.
The ``source`` column marks whether a statistic is pinned by construction or
free to vary. Read the *free* rows to judge how much the synthetic series
depart from the source in ways the rescaling does not control.
"""
avg_synthetic = {}
for key in original_stats:
avg_synthetic[key] = np.mean([s[key] for s in synthetic_stats_list])
header = (
f"{'Statistic':<15} {'Original':>12} {'Synthetic (avg)':>15} "
f"{'Diff %':>10} {'Source':<8}"
)
print(header)
print("-" * len(header))
for key in original_stats:
orig = original_stats[key]
synth = avg_synthetic[key]
if abs(orig) > 1e-6:
diff_pct = abs(synth - orig) / abs(orig) * 100
else:
diff_pct = 0 if abs(synth) < 1e-6 else 100
source = "pinned" if key in PINNED_STATS else "free"
print(
f"{key:<15} {orig:>12.4f} {synth:>15.4f} {diff_pct:>9.1f}% {source:<8}"
)
def correlation_to_source(original: np.ndarray, synthetic: np.ndarray) -> float:
"""Pearson correlation between a source series and one synthetic draw.
A value near 1.0 would mean the synthetic series is essentially a copy;
values near 0 mean it is an independent draw that only shares the pinned
summary statistics.
"""
n = min(len(original), len(synthetic))
o, s = original[:n], synthetic[:n]
mask = ~(np.isnan(o) | np.isnan(s))
if mask.sum() < 2:
return float("nan")
return float(np.corrcoef(o[mask], s[mask])[0, 1])
```
## M4 hourly data
Load hourly time series from the M4 competition and analyze their
patterns before augmenting.
```python theme={null}
tmpdir = tempfile.mkdtemp()
df_hourly, *_ = M4.load(directory=tmpdir, group="Hourly")
df_hourly = pl.from_pandas(df_hourly)
sample_ids = df_hourly["unique_id"].unique().head(5).to_list()
df_sample = df_hourly.filter(pl.col("unique_id").is_in(sample_ids))
print(f"Loaded {df_hourly['unique_id'].n_unique()} hourly series from M4")
print(f"Using {len(sample_ids)} series for demonstration: {sample_ids}")
print(f"Total rows in sample: {len(df_sample)}")
print("\nSample data (first series, first 5 rows):")
df_sample.filter(pl.col("unique_id") == sample_ids[0]).head(5)
```
```text theme={null}
0%| | 0.00/555k [00:00
### Analyzing series patterns
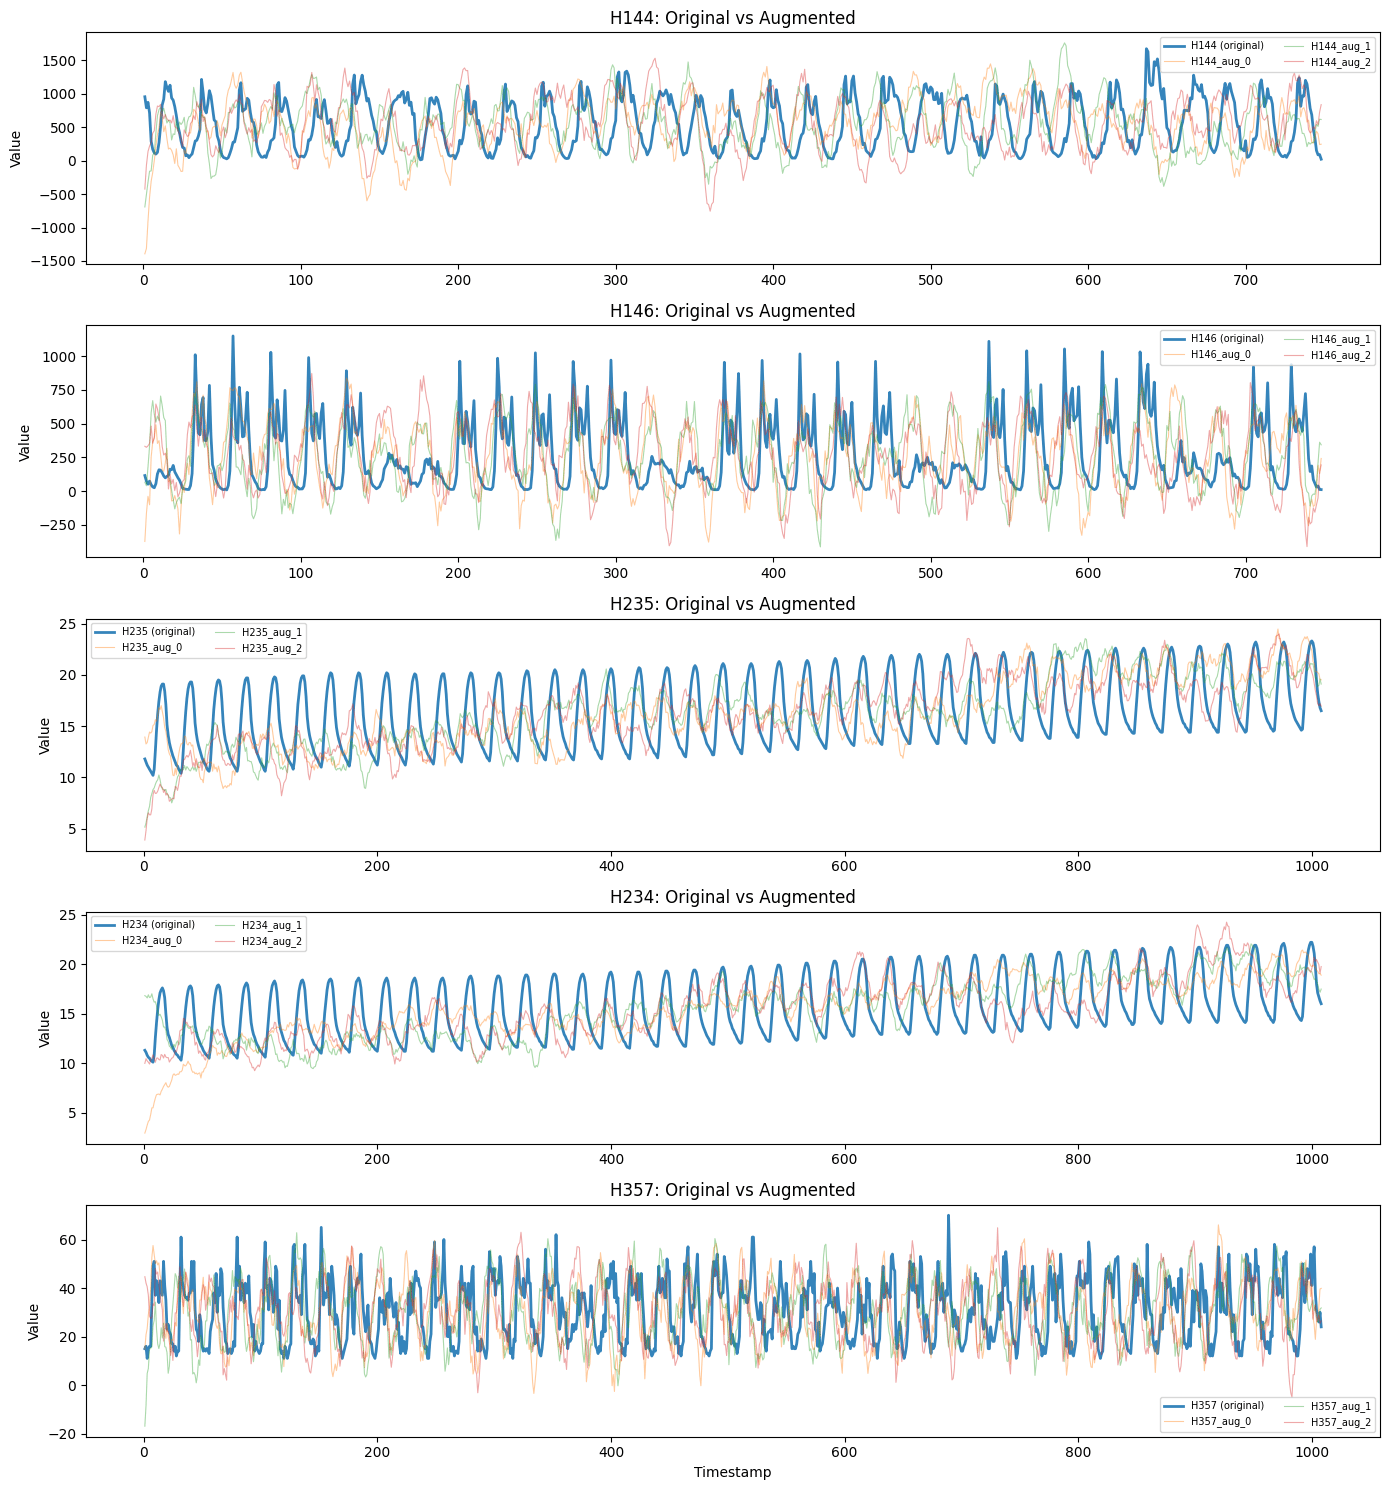
SynAugment detects seasonality, trend, and stationarity to choose the
best generator for each series.
```python theme={null}
augmenter = SynAugment(seed=42)
analysis = augmenter.analyze(df_sample)
for series_id in sample_ids:
info = analysis[series_id]
print(f"\n {series_id}:")
print(f" Recommended generator: {info['recommended_generator']}")
props = info["properties"]
print(f" Has seasonality: {props['seasonality']['has_seasonality']}")
if props["seasonality"]["has_seasonality"]:
print(f" Seasonality period: {props['seasonality']['period']}")
print(f" Has trend: {props['trend']['has_trend']}")
print(f" Is stationary: {props['stationarity']['is_stationary']}")
```
```text theme={null}
H144:
Recommended generator: SeasonalGenerator
Has seasonality: True
Seasonality period: 24
Has trend: False
Is stationary: True
H146:
Recommended generator: SeasonalGenerator
Has seasonality: True
Seasonality period: 24
Has trend: False
Is stationary: True
H235:
Recommended generator: SeasonalGenerator
Has seasonality: True
Seasonality period: 24
Has trend: True
Is stationary: True
H234:
Recommended generator: SeasonalGenerator
Has seasonality: True
Seasonality period: 24
Has trend: True
Is stationary: True
H357:
Recommended generator: SeasonalGenerator
Has seasonality: True
Seasonality period: 24
Has trend: False
Is stationary: True
```
### Augmenting the data
Generate 3 synthetic series per original series.
```python theme={null}
augmented_df = augmenter.augment(df_sample, n_augment=3)
print(f"Original series: {df_sample['unique_id'].n_unique()}")
print(f"Total series after augmentation: {augmented_df['unique_id'].n_unique()}")
```
```text theme={null}
Original series: 5
Total series after augmentation: 20
```
```python theme={null}
fig, axes = plt.subplots(len(sample_ids), 1, figsize=(14, 3 * len(sample_ids)))
for i, uid in enumerate(sample_ids):
ax = axes[i] if len(sample_ids) > 1 else axes
# Plot original
orig = augmented_df.filter(pl.col("unique_id") == uid)
ax.plot(orig["ds"].to_list(), orig["y"].to_list(), label=f"{uid} (original)", alpha=0.9, linewidth=2)
# Plot augmented
for j in range(3):
aug_id = f"{uid}_aug_{j}"
aug = augmented_df.filter(pl.col("unique_id") == aug_id)
if len(aug) > 0:
ax.plot(aug["ds"].to_list(), aug["y"].to_list(), label=aug_id, alpha=0.4, linewidth=0.8)
ax.set_title(f"{uid}: Original vs Augmented")
ax.set_ylabel("Value")
ax.legend(fontsize=7, ncol=2)
axes[-1].set_xlabel("Timestamp") if len(sample_ids) > 1 else axes.set_xlabel("Timestamp")
plt.tight_layout()
plt.show()
```
 ## What augmentation pins, and what it leaves free
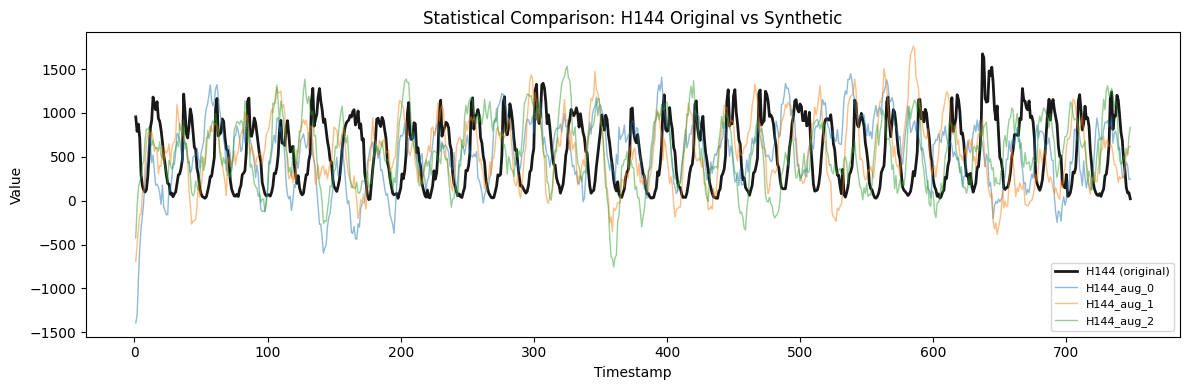
For one series, we compare the original statistics against the average
across its synthetic draws. The `mean`, `std`, `cv`, and `autocorr_lag1`
rows are pinned by construction — expect them near 0% and read nothing
into it. The `min`, `max`, `range`, and `skewness` rows are free to vary
and show how the synthetic draws differ in shape.
We also report the correlation between each synthetic draw and the
source series. Low correlations are the point here: they show the draws
are genuinely new series that happen to share the pinned summary
statistics, not rescaled copies of the input.
```python theme={null}
test_id = sample_ids[0]
print(f"Detailed comparison for series: {test_id}\n")
original_values = (
augmented_df.filter(pl.col("unique_id") == test_id).sort("ds")["y"].to_numpy()
)
original_stats = compute_series_stats(original_values)
synthetic_stats_list = []
correlations = []
for i in range(3):
aug_id = f"{test_id}_aug_{i}"
aug_values = (
augmented_df.filter(pl.col("unique_id") == aug_id)
.sort("ds")["y"]
.to_numpy()
)
synthetic_stats_list.append(compute_series_stats(aug_values))
correlations.append(correlation_to_source(original_values, aug_values))
print_comparison_table(original_stats, synthetic_stats_list)
print(
"\nCorrelation of each synthetic draw to the source series: "
+ ", ".join(f"{c:.2f}" for c in correlations)
)
print(
"Low correlations confirm the synthetic series are independent draws that "
"share the pinned statistics, not copies of the input."
)
```
```text theme={null}
Detailed comparison for series: H144
Statistic Original Synthetic (avg) Diff % Source
------------------------------------------------------------------
mean 551.3262 551.3307 0.0% pinned
std 382.3467 382.3399 0.0% pinned
min 12.0000 -946.5067 7987.6% free
max 1673.0000 1579.6324 5.6% free
range 1661.0000 2526.1390 52.1% free
cv 0.6935 0.6935 0.0% pinned
skewness 0.2819 -0.2291 181.3% free
autocorr_lag1 0.9034 0.9334 3.3% pinned
Correlation of each synthetic draw to the source series: -0.09, -0.11, 0.00
Low correlations confirm the synthetic series are independent draws that share the pinned statistics, not copies of the input.
```
```python theme={null}
fig, ax = plt.subplots(figsize=(12, 4))
# Plot original series
orig = augmented_df.filter(pl.col("unique_id") == test_id)
ax.plot(orig["ds"].to_list(), orig["y"].to_list(), label=f"{test_id} (original)", alpha=0.9, linewidth=2, color="black")
# Plot synthetic copies
for i in range(3):
aug_id = f"{test_id}_aug_{i}"
aug = augmented_df.filter(pl.col("unique_id") == aug_id)
if len(aug) > 0:
ax.plot(aug["ds"].to_list(), aug["y"].to_list(), label=aug_id, alpha=0.5, linewidth=1)
ax.set_title(f"Statistical Comparison: {test_id} Original vs Synthetic")
ax.set_xlabel("Timestamp")
ax.set_ylabel("Value")
ax.legend(fontsize=8)
plt.tight_layout()
plt.show()
```
## What augmentation pins, and what it leaves free
For one series, we compare the original statistics against the average
across its synthetic draws. The `mean`, `std`, `cv`, and `autocorr_lag1`
rows are pinned by construction — expect them near 0% and read nothing
into it. The `min`, `max`, `range`, and `skewness` rows are free to vary
and show how the synthetic draws differ in shape.
We also report the correlation between each synthetic draw and the
source series. Low correlations are the point here: they show the draws
are genuinely new series that happen to share the pinned summary
statistics, not rescaled copies of the input.
```python theme={null}
test_id = sample_ids[0]
print(f"Detailed comparison for series: {test_id}\n")
original_values = (
augmented_df.filter(pl.col("unique_id") == test_id).sort("ds")["y"].to_numpy()
)
original_stats = compute_series_stats(original_values)
synthetic_stats_list = []
correlations = []
for i in range(3):
aug_id = f"{test_id}_aug_{i}"
aug_values = (
augmented_df.filter(pl.col("unique_id") == aug_id)
.sort("ds")["y"]
.to_numpy()
)
synthetic_stats_list.append(compute_series_stats(aug_values))
correlations.append(correlation_to_source(original_values, aug_values))
print_comparison_table(original_stats, synthetic_stats_list)
print(
"\nCorrelation of each synthetic draw to the source series: "
+ ", ".join(f"{c:.2f}" for c in correlations)
)
print(
"Low correlations confirm the synthetic series are independent draws that "
"share the pinned statistics, not copies of the input."
)
```
```text theme={null}
Detailed comparison for series: H144
Statistic Original Synthetic (avg) Diff % Source
------------------------------------------------------------------
mean 551.3262 551.3307 0.0% pinned
std 382.3467 382.3399 0.0% pinned
min 12.0000 -946.5067 7987.6% free
max 1673.0000 1579.6324 5.6% free
range 1661.0000 2526.1390 52.1% free
cv 0.6935 0.6935 0.0% pinned
skewness 0.2819 -0.2291 181.3% free
autocorr_lag1 0.9034 0.9334 3.3% pinned
Correlation of each synthetic draw to the source series: -0.09, -0.11, 0.00
Low correlations confirm the synthetic series are independent draws that share the pinned statistics, not copies of the input.
```
```python theme={null}
fig, ax = plt.subplots(figsize=(12, 4))
# Plot original series
orig = augmented_df.filter(pl.col("unique_id") == test_id)
ax.plot(orig["ds"].to_list(), orig["y"].to_list(), label=f"{test_id} (original)", alpha=0.9, linewidth=2, color="black")
# Plot synthetic copies
for i in range(3):
aug_id = f"{test_id}_aug_{i}"
aug = augmented_df.filter(pl.col("unique_id") == aug_id)
if len(aug) > 0:
ax.plot(aug["ds"].to_list(), aug["y"].to_list(), label=aug_id, alpha=0.5, linewidth=1)
ax.set_title(f"Statistical Comparison: {test_id} Original vs Synthetic")
ax.set_xlabel("Timestamp")
ax.set_ylabel("Value")
ax.legend(fontsize=8)
plt.tight_layout()
plt.show()
```
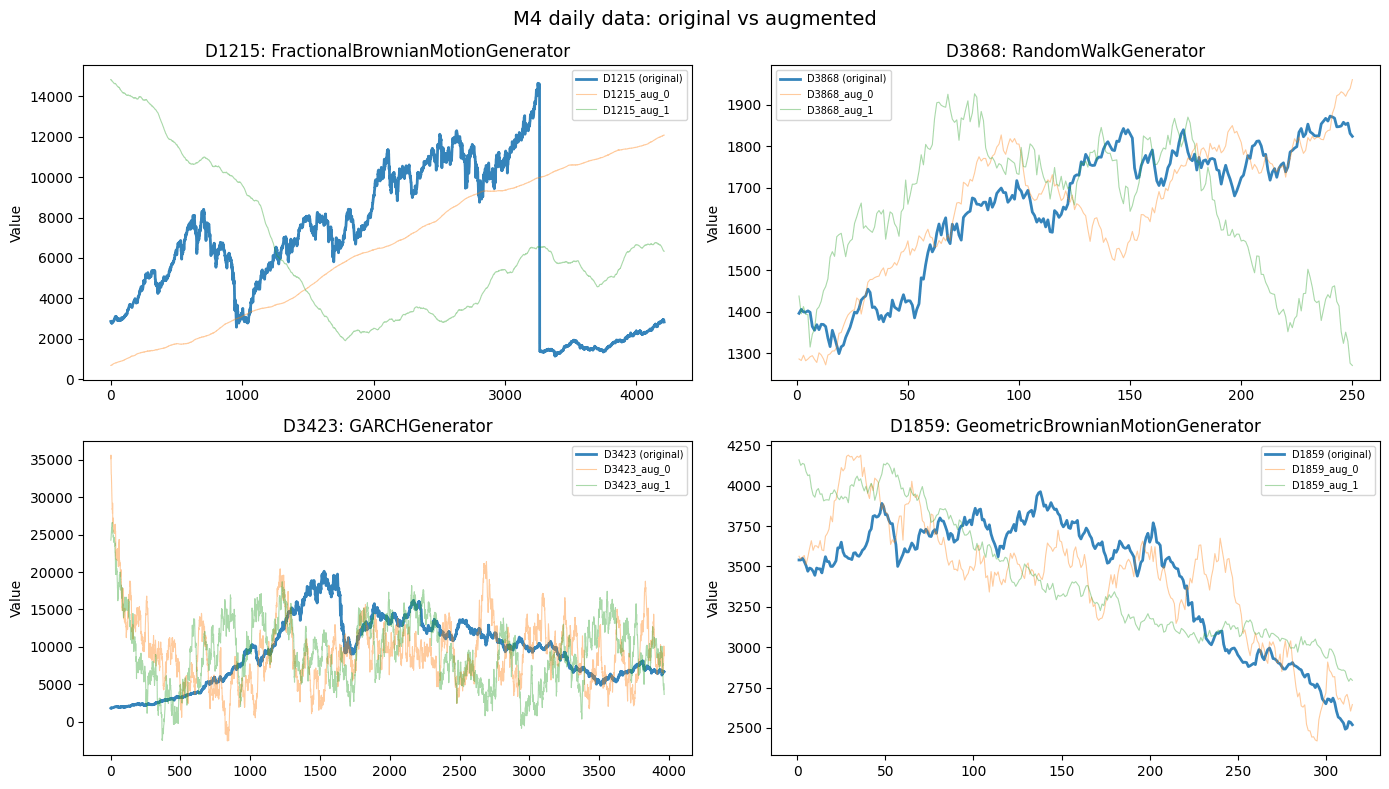
 ## M4 daily data
Augment daily frequency data from the M4 competition.
```python theme={null}
df_daily, *_ = M4.load(directory=tmpdir, group="Daily")
df_daily = pl.from_pandas(df_daily)
daily_ids = df_daily["unique_id"].unique().head(4).to_list()
df_daily_sample = df_daily.filter(pl.col("unique_id").is_in(daily_ids))
print(f"Loaded {df_daily['unique_id'].n_unique()} daily series from M4")
print(f"Using {len(daily_ids)} series: {daily_ids}")
augmenter_daily = SynAugment(seed=123)
analysis_daily = augmenter_daily.analyze(df_daily_sample)
print("\nAnalysis results:")
for series_id in daily_ids:
info = analysis_daily[series_id]
print(f" {series_id}: {info['recommended_generator']}")
augmented_daily = augmenter_daily.augment(df_daily_sample, n_augment=2)
print(
f"\nAugmented from {len(daily_ids)} to {augmented_daily['unique_id'].n_unique()} series"
)
```
```text theme={null}
0%| | 0.00/32.5M [00:00 0:
ax.plot(aug["ds"].to_list(), aug["y"].to_list(), label=aug_id, alpha=0.4, linewidth=0.8)
ax.set_title(f"{uid}: {analysis_daily[uid]['recommended_generator']}")
ax.set_ylabel("Value")
ax.legend(fontsize=7)
plt.suptitle("M4 daily data: original vs augmented", fontsize=14)
plt.tight_layout()
plt.show()
```
## M4 daily data
Augment daily frequency data from the M4 competition.
```python theme={null}
df_daily, *_ = M4.load(directory=tmpdir, group="Daily")
df_daily = pl.from_pandas(df_daily)
daily_ids = df_daily["unique_id"].unique().head(4).to_list()
df_daily_sample = df_daily.filter(pl.col("unique_id").is_in(daily_ids))
print(f"Loaded {df_daily['unique_id'].n_unique()} daily series from M4")
print(f"Using {len(daily_ids)} series: {daily_ids}")
augmenter_daily = SynAugment(seed=123)
analysis_daily = augmenter_daily.analyze(df_daily_sample)
print("\nAnalysis results:")
for series_id in daily_ids:
info = analysis_daily[series_id]
print(f" {series_id}: {info['recommended_generator']}")
augmented_daily = augmenter_daily.augment(df_daily_sample, n_augment=2)
print(
f"\nAugmented from {len(daily_ids)} to {augmented_daily['unique_id'].n_unique()} series"
)
```
```text theme={null}
0%| | 0.00/32.5M [00:00 0:
ax.plot(aug["ds"].to_list(), aug["y"].to_list(), label=aug_id, alpha=0.4, linewidth=0.8)
ax.set_title(f"{uid}: {analysis_daily[uid]['recommended_generator']}")
ax.set_ylabel("Value")
ax.legend(fontsize=7)
plt.suptitle("M4 daily data: original vs augmented", fontsize=14)
plt.tight_layout()
plt.show()
```
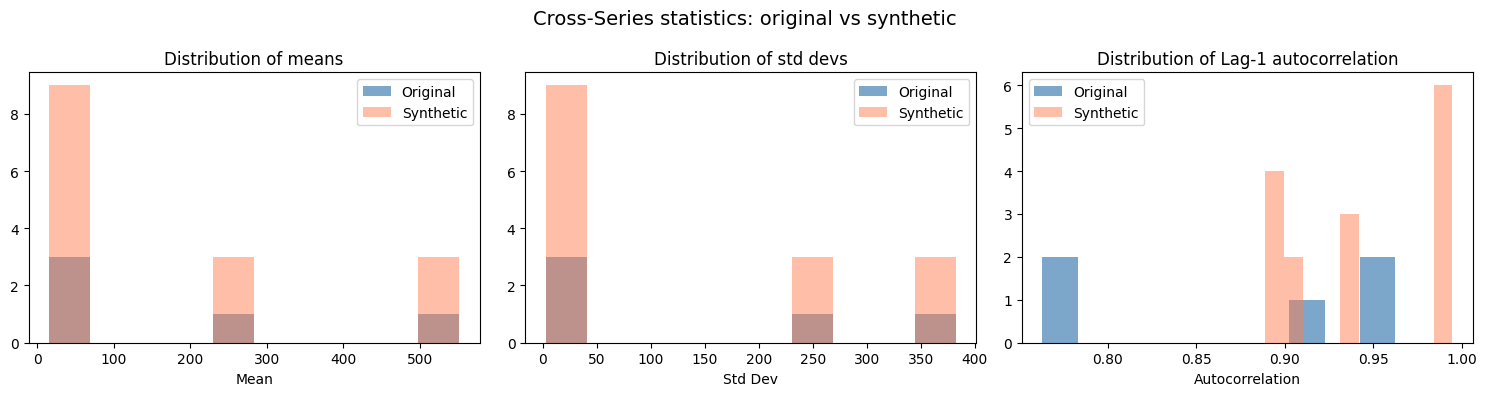
 ## Cross-series statistics
Because every synthetic series is pinned to its source’s mean and std,
the panel-level averages of those statistics line up almost exactly.
That confirms the pinning holds across the whole panel — it is not
emergent fidelity. In the histograms the synthetic means and stds stack
on the same locations as the originals (three synthetic draws per
source), while the lag-1 autocorrelation, which is only *approximately*
targeted, shows a little more spread.
```python theme={null}
original_means = []
original_stds = []
original_autocorrs = []
for series_id in sample_ids:
values = (
df_sample.filter(pl.col("unique_id") == series_id)
.sort("ds")["y"]
.to_numpy()
)
original_means.append(np.mean(values))
original_stds.append(np.std(values))
if len(values) > 1:
original_autocorrs.append(np.corrcoef(values[:-1], values[1:])[0, 1])
synthetic_means = []
synthetic_stds = []
synthetic_autocorrs = []
synthetic_ids = [
uid
for uid in augmented_df["unique_id"].unique().to_list()
if "_aug_" in str(uid)
]
for series_id in synthetic_ids:
values = (
augmented_df.filter(pl.col("unique_id") == series_id)
.sort("ds")["y"]
.to_numpy()
)
synthetic_means.append(np.mean(values))
synthetic_stds.append(np.std(values))
if len(values) > 1:
synthetic_autocorrs.append(np.corrcoef(values[:-1], values[1:])[0, 1])
print(f"Original series ({len(sample_ids)} series):")
print(
f" Mean of means: {np.mean(original_means):.4f} (std: {np.std(original_means):.4f})"
)
print(
f" Mean of stds: {np.mean(original_stds):.4f} (std: {np.std(original_stds):.4f})"
)
print(
f" Mean autocorr: {np.mean(original_autocorrs):.4f} (std: {np.std(original_autocorrs):.4f})"
)
print(f"\nSynthetic series ({len(synthetic_ids)} series):")
print(
f" Mean of means: {np.mean(synthetic_means):.4f} (std: {np.std(synthetic_means):.4f})"
)
print(
f" Mean of stds: {np.mean(synthetic_stds):.4f} (std: {np.std(synthetic_stds):.4f})"
)
print(
f" Mean autocorr: {np.mean(synthetic_autocorrs):.4f} (std: {np.std(synthetic_autocorrs):.4f})"
)
```
```text theme={null}
Original series (5 series):
Mean of means: 175.2437 (std: 210.1079)
Mean of stds: 130.3940 (std: 157.5724)
Mean autocorr: 0.8746 (std: 0.0858)
Synthetic series (15 series):
Mean of means: 175.2455 (std: 210.1099)
Mean of stds: 130.3943 (std: 157.5715)
Mean autocorr: 0.9418 (std: 0.0417)
```
```python theme={null}
fig, axes = plt.subplots(1, 3, figsize=(15, 4))
axes[0].hist(original_means, bins=10, alpha=0.7, label="Original", color="steelblue")
axes[0].hist(synthetic_means, bins=10, alpha=0.5, label="Synthetic", color="coral")
axes[0].set_title("Distribution of means")
axes[0].set_xlabel("Mean")
axes[0].legend()
axes[1].hist(original_stds, bins=10, alpha=0.7, label="Original", color="steelblue")
axes[1].hist(synthetic_stds, bins=10, alpha=0.5, label="Synthetic", color="coral")
axes[1].set_title("Distribution of std devs")
axes[1].set_xlabel("Std Dev")
axes[1].legend()
axes[2].hist(original_autocorrs, bins=10, alpha=0.7, label="Original", color="steelblue")
axes[2].hist(synthetic_autocorrs, bins=10, alpha=0.5, label="Synthetic", color="coral")
axes[2].set_title("Distribution of Lag-1 autocorrelation")
axes[2].set_xlabel("Autocorrelation")
axes[2].legend()
plt.suptitle("Cross-Series statistics: original vs synthetic", fontsize=14)
plt.tight_layout()
plt.show()
```
## Cross-series statistics
Because every synthetic series is pinned to its source’s mean and std,
the panel-level averages of those statistics line up almost exactly.
That confirms the pinning holds across the whole panel — it is not
emergent fidelity. In the histograms the synthetic means and stds stack
on the same locations as the originals (three synthetic draws per
source), while the lag-1 autocorrelation, which is only *approximately*
targeted, shows a little more spread.
```python theme={null}
original_means = []
original_stds = []
original_autocorrs = []
for series_id in sample_ids:
values = (
df_sample.filter(pl.col("unique_id") == series_id)
.sort("ds")["y"]
.to_numpy()
)
original_means.append(np.mean(values))
original_stds.append(np.std(values))
if len(values) > 1:
original_autocorrs.append(np.corrcoef(values[:-1], values[1:])[0, 1])
synthetic_means = []
synthetic_stds = []
synthetic_autocorrs = []
synthetic_ids = [
uid
for uid in augmented_df["unique_id"].unique().to_list()
if "_aug_" in str(uid)
]
for series_id in synthetic_ids:
values = (
augmented_df.filter(pl.col("unique_id") == series_id)
.sort("ds")["y"]
.to_numpy()
)
synthetic_means.append(np.mean(values))
synthetic_stds.append(np.std(values))
if len(values) > 1:
synthetic_autocorrs.append(np.corrcoef(values[:-1], values[1:])[0, 1])
print(f"Original series ({len(sample_ids)} series):")
print(
f" Mean of means: {np.mean(original_means):.4f} (std: {np.std(original_means):.4f})"
)
print(
f" Mean of stds: {np.mean(original_stds):.4f} (std: {np.std(original_stds):.4f})"
)
print(
f" Mean autocorr: {np.mean(original_autocorrs):.4f} (std: {np.std(original_autocorrs):.4f})"
)
print(f"\nSynthetic series ({len(synthetic_ids)} series):")
print(
f" Mean of means: {np.mean(synthetic_means):.4f} (std: {np.std(synthetic_means):.4f})"
)
print(
f" Mean of stds: {np.mean(synthetic_stds):.4f} (std: {np.std(synthetic_stds):.4f})"
)
print(
f" Mean autocorr: {np.mean(synthetic_autocorrs):.4f} (std: {np.std(synthetic_autocorrs):.4f})"
)
```
```text theme={null}
Original series (5 series):
Mean of means: 175.2437 (std: 210.1079)
Mean of stds: 130.3940 (std: 157.5724)
Mean autocorr: 0.8746 (std: 0.0858)
Synthetic series (15 series):
Mean of means: 175.2455 (std: 210.1099)
Mean of stds: 130.3943 (std: 157.5715)
Mean autocorr: 0.9418 (std: 0.0417)
```
```python theme={null}
fig, axes = plt.subplots(1, 3, figsize=(15, 4))
axes[0].hist(original_means, bins=10, alpha=0.7, label="Original", color="steelblue")
axes[0].hist(synthetic_means, bins=10, alpha=0.5, label="Synthetic", color="coral")
axes[0].set_title("Distribution of means")
axes[0].set_xlabel("Mean")
axes[0].legend()
axes[1].hist(original_stds, bins=10, alpha=0.7, label="Original", color="steelblue")
axes[1].hist(synthetic_stds, bins=10, alpha=0.5, label="Synthetic", color="coral")
axes[1].set_title("Distribution of std devs")
axes[1].set_xlabel("Std Dev")
axes[1].legend()
axes[2].hist(original_autocorrs, bins=10, alpha=0.7, label="Original", color="steelblue")
axes[2].hist(synthetic_autocorrs, bins=10, alpha=0.5, label="Synthetic", color="coral")
axes[2].set_title("Distribution of Lag-1 autocorrelation")
axes[2].set_xlabel("Autocorrelation")
axes[2].legend()
plt.suptitle("Cross-Series statistics: original vs synthetic", fontsize=14)
plt.tight_layout()
plt.show()
```
 ## Augmenting for ML training
A common use case: expand a small dataset to create a larger training
set for ML models.
```python theme={null}
small_dataset = df_hourly.filter(
pl.col("unique_id").is_in(df_hourly["unique_id"].unique().head(10).to_list())
)
print(f"Original training set: {small_dataset['unique_id'].n_unique()} series")
print(f"Total observations: {len(small_dataset)}")
ml_augmenter = SynAugment(seed=42)
expanded_dataset = ml_augmenter.augment(small_dataset, n_augment=5)
print(f"\nExpanded training set: {expanded_dataset['unique_id'].n_unique()} series")
print(f"Total observations: {len(expanded_dataset)}")
print(f"Expansion factor: {len(expanded_dataset) / len(small_dataset):.1f}x")
lengths = expanded_dataset.group_by("unique_id").agg(pl.len().alias("length"))
print(f"\nSeries length distribution:")
print(f" Min: {lengths['length'].min()}, Max: {lengths['length'].max()}")
print(f" Mean: {lengths['length'].mean():.1f}")
```
```text theme={null}
Original training set: 10 series
Total observations: 9300
Expanded training set: 60 series
Total observations: 55800
Expansion factor: 6.0x
Series length distribution:
Min: 748, Max: 1008
Mean: 930.0
```
## A non-duplication check
Before using an augmented panel, a basic sanity check is whether its
synthetic draws are near-copies of the source series. `SynAugment` pins
each synthetic series to its source’s summary statistics but draws the
series fresh. The check below measures non-duplication only; it is not a
privacy test.
To check, we z-normalize every series (dropping the pinned mean and std
so we compare shape, not level) and measure how far each synthetic
series is from its nearest real series. The distances between the real
series themselves give the reference scale.
```python theme={null}
import itertools
def _znorm(a):
return (a - np.mean(a)) / (np.std(a) + 1e-9)
privacy_real = {
u: df_sample.filter(pl.col('unique_id') == u).sort('ds')['y'].to_numpy()
for u in sample_ids
}
_L = min(len(v) for v in privacy_real.values())
_R = {u: _znorm(v[:_L]) for u, v in privacy_real.items()}
def _zdist(a, b):
return float(np.sqrt(np.mean((a - b) ** 2)))
real_real = np.array([_zdist(_R[a], _R[b]) for a, b in itertools.combinations(_R, 2)])
syn_ids_priv = [u for u in augmented_df['unique_id'].unique().to_list() if '_aug_' in u]
syn_nn = np.array([
min(_zdist(_znorm(augmented_df.filter(pl.col('unique_id') == sid)
.sort('ds')['y'].to_numpy()[:_L]), _R[u]) for u in _R)
for sid in syn_ids_priv
])
print(f'closest pair of REAL series: z-distance {real_real.min():.2f}')
print(f'every synthetic to its NEAREST real: z-distance >= {syn_nn.min():.2f}')
print(f'synthetic closer to a real than the closest real-real pair: '
f'{int((syn_nn < real_real.min()).sum())} / {len(syn_nn)}')
fig, ax = plt.subplots(figsize=(9, 4))
bins = np.linspace(0, max(real_real.max(), syn_nn.max()) * 1.05, 20)
ax.hist(real_real, bins=bins, alpha=0.7, color='steelblue',
label='real vs real (reference)')
ax.hist(syn_nn, bins=bins, alpha=0.6, color='mediumpurple',
label='synthetic vs nearest real')
ax.axvline(0.0, color='crimson', ls='--', label='exact copy (distance 0)')
ax.set(xlabel='z-normalized RMSE between series', ylabel='count',
title='Synthetic-to-real distances in this sample')
ax.legend()
plt.tight_layout()
plt.show()
```
```text theme={null}
closest pair of REAL series: z-distance 0.12
every synthetic to its NEAREST real: z-distance >= 1.06
synthetic closer to a real than the closest real-real pair: 0 / 15
```
## Augmenting for ML training
A common use case: expand a small dataset to create a larger training
set for ML models.
```python theme={null}
small_dataset = df_hourly.filter(
pl.col("unique_id").is_in(df_hourly["unique_id"].unique().head(10).to_list())
)
print(f"Original training set: {small_dataset['unique_id'].n_unique()} series")
print(f"Total observations: {len(small_dataset)}")
ml_augmenter = SynAugment(seed=42)
expanded_dataset = ml_augmenter.augment(small_dataset, n_augment=5)
print(f"\nExpanded training set: {expanded_dataset['unique_id'].n_unique()} series")
print(f"Total observations: {len(expanded_dataset)}")
print(f"Expansion factor: {len(expanded_dataset) / len(small_dataset):.1f}x")
lengths = expanded_dataset.group_by("unique_id").agg(pl.len().alias("length"))
print(f"\nSeries length distribution:")
print(f" Min: {lengths['length'].min()}, Max: {lengths['length'].max()}")
print(f" Mean: {lengths['length'].mean():.1f}")
```
```text theme={null}
Original training set: 10 series
Total observations: 9300
Expanded training set: 60 series
Total observations: 55800
Expansion factor: 6.0x
Series length distribution:
Min: 748, Max: 1008
Mean: 930.0
```
## A non-duplication check
Before using an augmented panel, a basic sanity check is whether its
synthetic draws are near-copies of the source series. `SynAugment` pins
each synthetic series to its source’s summary statistics but draws the
series fresh. The check below measures non-duplication only; it is not a
privacy test.
To check, we z-normalize every series (dropping the pinned mean and std
so we compare shape, not level) and measure how far each synthetic
series is from its nearest real series. The distances between the real
series themselves give the reference scale.
```python theme={null}
import itertools
def _znorm(a):
return (a - np.mean(a)) / (np.std(a) + 1e-9)
privacy_real = {
u: df_sample.filter(pl.col('unique_id') == u).sort('ds')['y'].to_numpy()
for u in sample_ids
}
_L = min(len(v) for v in privacy_real.values())
_R = {u: _znorm(v[:_L]) for u, v in privacy_real.items()}
def _zdist(a, b):
return float(np.sqrt(np.mean((a - b) ** 2)))
real_real = np.array([_zdist(_R[a], _R[b]) for a, b in itertools.combinations(_R, 2)])
syn_ids_priv = [u for u in augmented_df['unique_id'].unique().to_list() if '_aug_' in u]
syn_nn = np.array([
min(_zdist(_znorm(augmented_df.filter(pl.col('unique_id') == sid)
.sort('ds')['y'].to_numpy()[:_L]), _R[u]) for u in _R)
for sid in syn_ids_priv
])
print(f'closest pair of REAL series: z-distance {real_real.min():.2f}')
print(f'every synthetic to its NEAREST real: z-distance >= {syn_nn.min():.2f}')
print(f'synthetic closer to a real than the closest real-real pair: '
f'{int((syn_nn < real_real.min()).sum())} / {len(syn_nn)}')
fig, ax = plt.subplots(figsize=(9, 4))
bins = np.linspace(0, max(real_real.max(), syn_nn.max()) * 1.05, 20)
ax.hist(real_real, bins=bins, alpha=0.7, color='steelblue',
label='real vs real (reference)')
ax.hist(syn_nn, bins=bins, alpha=0.6, color='mediumpurple',
label='synthetic vs nearest real')
ax.axvline(0.0, color='crimson', ls='--', label='exact copy (distance 0)')
ax.set(xlabel='z-normalized RMSE between series', ylabel='count',
title='Synthetic-to-real distances in this sample')
ax.legend()
plt.tight_layout()
plt.show()
```
```text theme={null}
closest pair of REAL series: z-distance 0.12
every synthetic to its NEAREST real: z-distance >= 1.06
synthetic closer to a real than the closest real-real pair: 0 / 15
```
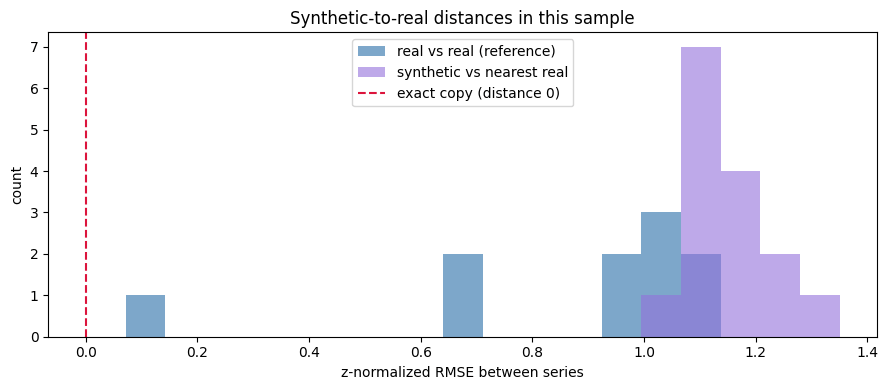 In this sample, every synthetic series sits farther from its nearest
real series than the closest pair of real series sit from each other,
and none lands near the zero-distance mark an exact copy would. This
rules out exact and near duplicates under this one distance metric; it
does not test resistance to reconstruction or inference attacks.
> **What this is, and is not**
>
> This is only an empirical non-duplication check under z-normalized
> RMSE. It does not establish resistance to reconstruction, membership
> inference, attribute inference, or other privacy attacks. `SynAugment`
> provides no differential-privacy guarantee or epsilon bound. For
> sensitive or regulated data, use a dedicated disclosure-risk
> assessment and appropriate privacy controls.
## Summary
* `SynAugment` guarantees the mean, standard deviation, and lag-1
autocorrelation of each synthetic series by rescaling it to its
source. Treat those matches as a property of the method, not as a
validation result.
* The synthetic series are new draws rather than copies: their
trajectories decorrelate from the source, and their distribution
shape (min, max, skewness) varies freely around the pinned moments.
* Use augmentation to expand a small panel with series that share the
summary statistics of the originals. Fit augmentation parameters on
the training split only, and choose the augmentation ratio on
validation data — never on the final holdout.
* Before sharing, run non-duplication and domain-specific
disclosure-risk checks. This example’s distance test is a sanity
check, not evidence of privacy.
In this sample, every synthetic series sits farther from its nearest
real series than the closest pair of real series sit from each other,
and none lands near the zero-distance mark an exact copy would. This
rules out exact and near duplicates under this one distance metric; it
does not test resistance to reconstruction or inference attacks.
> **What this is, and is not**
>
> This is only an empirical non-duplication check under z-normalized
> RMSE. It does not establish resistance to reconstruction, membership
> inference, attribute inference, or other privacy attacks. `SynAugment`
> provides no differential-privacy guarantee or epsilon bound. For
> sensitive or regulated data, use a dedicated disclosure-risk
> assessment and appropriate privacy controls.
## Summary
* `SynAugment` guarantees the mean, standard deviation, and lag-1
autocorrelation of each synthetic series by rescaling it to its
source. Treat those matches as a property of the method, not as a
validation result.
* The synthetic series are new draws rather than copies: their
trajectories decorrelate from the source, and their distribution
shape (min, max, skewness) varies freely around the pinned moments.
* Use augmentation to expand a small panel with series that share the
summary statistics of the originals. Fit augmentation parameters on
the training split only, and choose the augmentation ratio on
validation data — never on the final holdout.
* Before sharing, run non-duplication and domain-specific
disclosure-risk checks. This example’s distance test is a sanity
check, not evidence of privacy.