> ## Documentation Index
> Fetch the complete documentation index at: https://nixtlaverse.nixtla.io/llms.txt
> Use this file to discover all available pages before exploring further.
# Target transformations
> Seamlessly transform target values
Since mlforecast uses a single global model it can be helpful to apply
some transformations to the target to ensure that all series have
similar distributions. They can also help remove trend for models that
can’t deal with it out of the box.
## Data setup
For this example we’ll use a single series from the M4 dataset.
```python theme={null}
import matplotlib.pyplot as plt
import numpy as np
import pandas as pd
from datasetsforecast.m4 import M4
from sklearn.base import BaseEstimator
from mlforecast import MLForecast
from mlforecast.target_transforms import Differences, LocalStandardScaler
```
```python theme={null}
data_path = 'data'
await M4.async_download(data_path, group='Hourly')
df, *_ = M4.load(data_path, 'Hourly')
df['ds'] = df['ds'].astype('int32')
serie = df[df['unique_id'].eq('H196')]
```
## Local transformations
> Transformations applied per series
### Differences
We’ll take a look at our series to see possible differences that would
help our models.
```python theme={null}
def plot(series, fname):
n_series = len(series)
fig, ax = plt.subplots(ncols=n_series, figsize=(7 * n_series, 6), squeeze=False)
for (title, serie), axi in zip(series.items(), ax.flat):
serie.set_index('ds')['y'].plot(title=title, ax=axi)
fig.savefig(f'../../figs/{fname}', bbox_inches='tight')
plt.close()
```
```python theme={null}
plot({'original': serie}, 'target_transforms__eda.png')
```
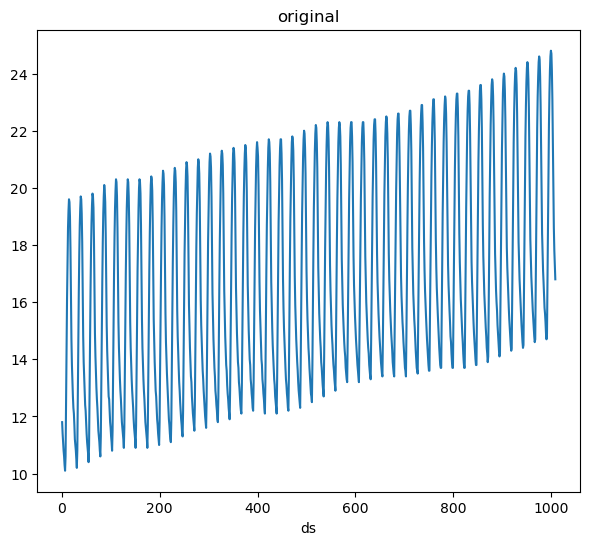 We can see that our data has a trend as well as a clear seasonality. We
can try removing the trend first.
```python theme={null}
fcst = MLForecast(
models=[],
freq=1,
target_transforms=[Differences([1])],
)
without_trend = fcst.preprocess(serie)
plot({'original': serie, 'without trend': without_trend}, 'target_transforms__diff1.png')
```
We can see that our data has a trend as well as a clear seasonality. We
can try removing the trend first.
```python theme={null}
fcst = MLForecast(
models=[],
freq=1,
target_transforms=[Differences([1])],
)
without_trend = fcst.preprocess(serie)
plot({'original': serie, 'without trend': without_trend}, 'target_transforms__diff1.png')
```
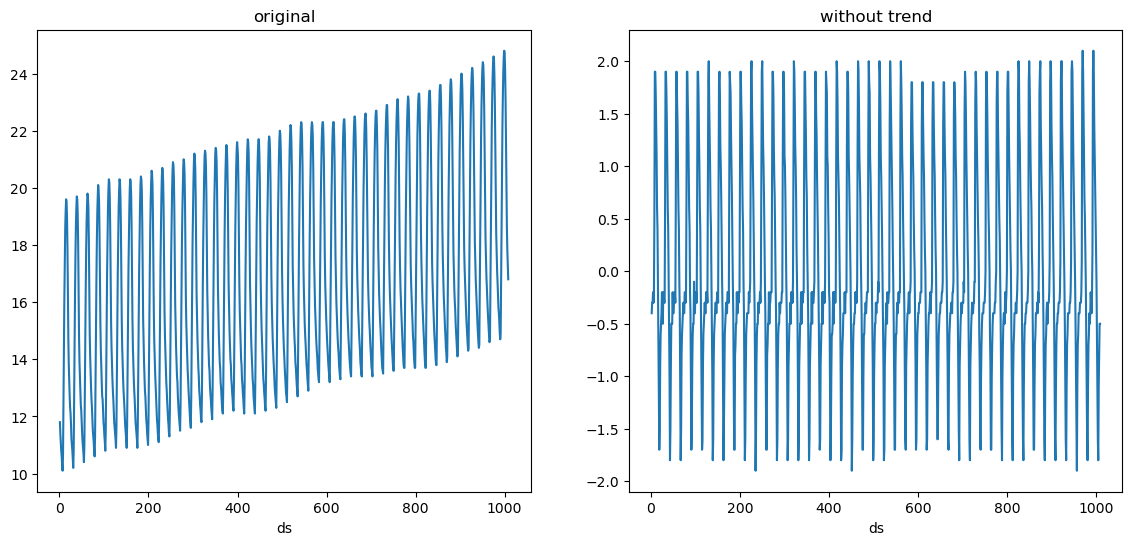 The trend is gone, we can now try taking the 24 difference (subtract the
value at the same hour in the previous day).
```python theme={null}
fcst = MLForecast(
models=[],
freq=1,
target_transforms=[Differences([1, 24])],
)
without_trend_and_seasonality = fcst.preprocess(serie)
plot({'original': serie, 'without trend and seasonality': without_trend_and_seasonality}, 'target_transforms__diff2.png')
```
The trend is gone, we can now try taking the 24 difference (subtract the
value at the same hour in the previous day).
```python theme={null}
fcst = MLForecast(
models=[],
freq=1,
target_transforms=[Differences([1, 24])],
)
without_trend_and_seasonality = fcst.preprocess(serie)
plot({'original': serie, 'without trend and seasonality': without_trend_and_seasonality}, 'target_transforms__diff2.png')
```
 ### LocalStandardScaler
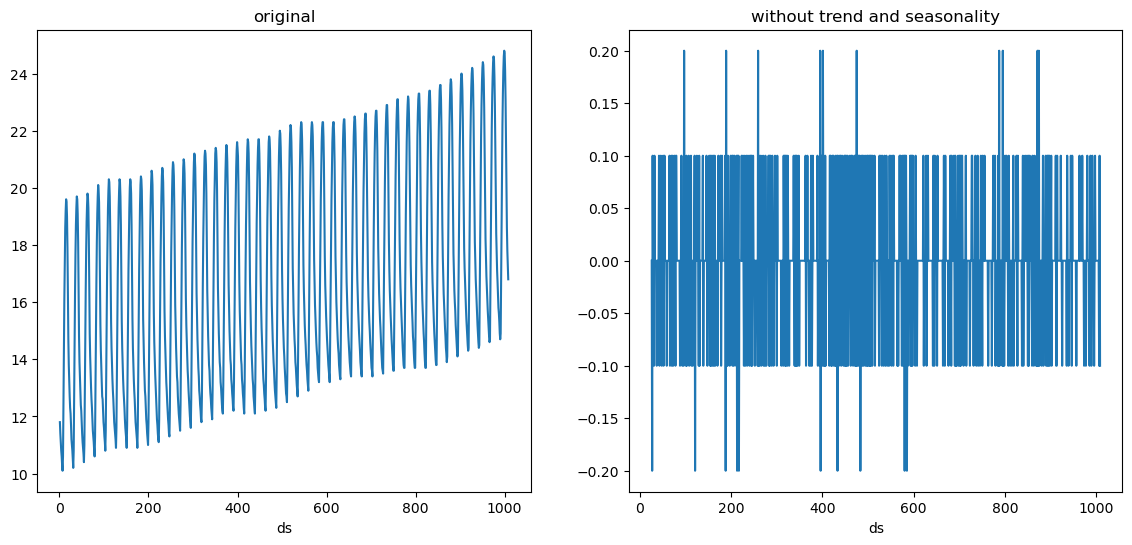
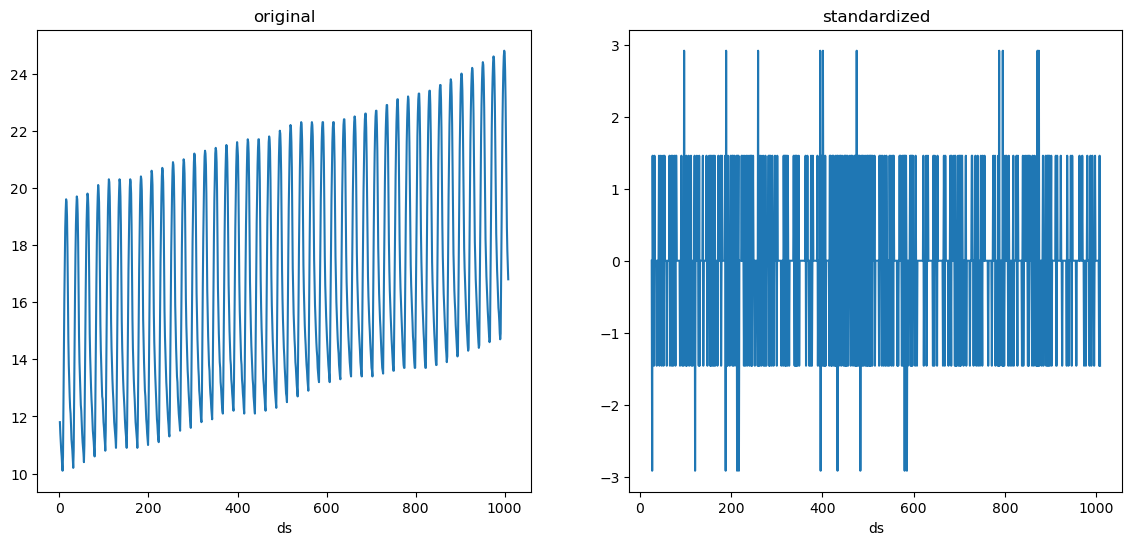
We see that our series is random noise now. Suppose we also want to
standardize it, i.e. make it have a mean of 0 and variance of 1. We can
add the LocalStandardScaler transformation after these differences.
```python theme={null}
fcst = MLForecast(
models=[],
freq=1,
target_transforms=[Differences([1, 24]), LocalStandardScaler()],
)
standardized = fcst.preprocess(serie)
plot({'original': serie, 'standardized': standardized}, 'target_transforms__standardized.png')
standardized['y'].agg(['mean', 'var']).round(2)
```
```text theme={null}
mean -0.0
var 1.0
Name: y, dtype: float64
```
### LocalStandardScaler
We see that our series is random noise now. Suppose we also want to
standardize it, i.e. make it have a mean of 0 and variance of 1. We can
add the LocalStandardScaler transformation after these differences.
```python theme={null}
fcst = MLForecast(
models=[],
freq=1,
target_transforms=[Differences([1, 24]), LocalStandardScaler()],
)
standardized = fcst.preprocess(serie)
plot({'original': serie, 'standardized': standardized}, 'target_transforms__standardized.png')
standardized['y'].agg(['mean', 'var']).round(2)
```
```text theme={null}
mean -0.0
var 1.0
Name: y, dtype: float64
```
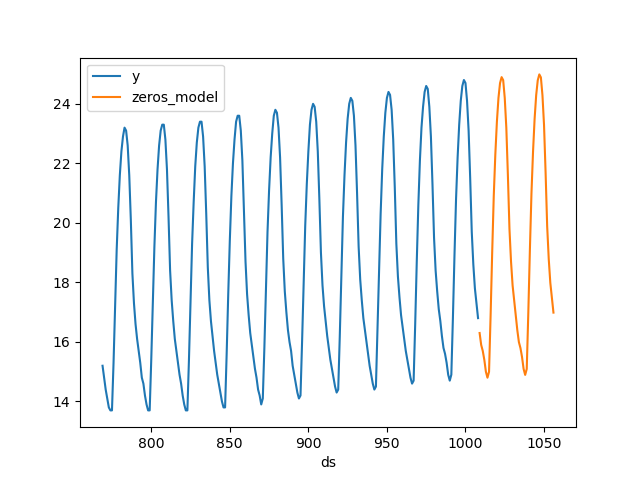
 Now that we’ve captured the components of the series (trend +
seasonality), we could try forecasting it with a model that always
predicts 0, which will basically project the trend and seasonality.
```python theme={null}
class Zeros(BaseEstimator):
def fit(self, X, y=None):
return self
def predict(self, X, y=None):
return np.zeros(X.shape[0])
fcst = MLForecast(
models={'zeros_model': Zeros()},
freq=1,
target_transforms=[Differences([1, 24]), LocalStandardScaler()],
)
preds = fcst.fit(serie).predict(48)
fig, ax = plt.subplots()
pd.concat([serie.tail(24 * 10), preds]).set_index('ds').plot(ax=ax)
plt.close()
```
Now that we’ve captured the components of the series (trend +
seasonality), we could try forecasting it with a model that always
predicts 0, which will basically project the trend and seasonality.
```python theme={null}
class Zeros(BaseEstimator):
def fit(self, X, y=None):
return self
def predict(self, X, y=None):
return np.zeros(X.shape[0])
fcst = MLForecast(
models={'zeros_model': Zeros()},
freq=1,
target_transforms=[Differences([1, 24]), LocalStandardScaler()],
)
preds = fcst.fit(serie).predict(48)
fig, ax = plt.subplots()
pd.concat([serie.tail(24 * 10), preds]).set_index('ds').plot(ax=ax)
plt.close()
```
 ## Global transformations
> Transformations applied to all series
### GlobalSklearnTransformer
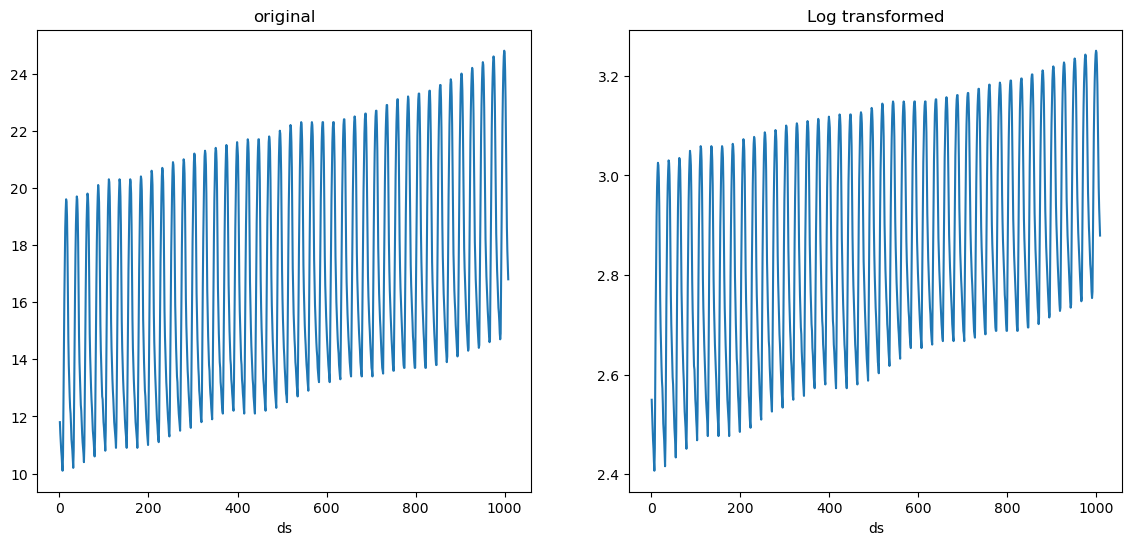
There are some transformations that don’t require to learn any
parameters, such as applying logarithm for example. These can be easily
defined using the `GlobalSklearnTransformer`, which takes a scikit-learn
compatible transformer and applies it to all series. Here’s an example
on how to define a transformation that applies logarithm to each value
of the series + 1, which can help avoid computing the log of 0.
```python theme={null}
import numpy as np
from sklearn.preprocessing import FunctionTransformer
from mlforecast.target_transforms import GlobalSklearnTransformer
sk_log1p = FunctionTransformer(func=np.log1p, inverse_func=np.expm1)
fcst = MLForecast(
models={'zeros_model': Zeros()},
freq=1,
target_transforms=[GlobalSklearnTransformer(sk_log1p)],
)
log1p_transformed = fcst.preprocess(serie)
plot({'original': serie, 'Log transformed': log1p_transformed}, 'target_transforms__log.png')
```
## Global transformations
> Transformations applied to all series
### GlobalSklearnTransformer
There are some transformations that don’t require to learn any
parameters, such as applying logarithm for example. These can be easily
defined using the `GlobalSklearnTransformer`, which takes a scikit-learn
compatible transformer and applies it to all series. Here’s an example
on how to define a transformation that applies logarithm to each value
of the series + 1, which can help avoid computing the log of 0.
```python theme={null}
import numpy as np
from sklearn.preprocessing import FunctionTransformer
from mlforecast.target_transforms import GlobalSklearnTransformer
sk_log1p = FunctionTransformer(func=np.log1p, inverse_func=np.expm1)
fcst = MLForecast(
models={'zeros_model': Zeros()},
freq=1,
target_transforms=[GlobalSklearnTransformer(sk_log1p)],
)
log1p_transformed = fcst.preprocess(serie)
plot({'original': serie, 'Log transformed': log1p_transformed}, 'target_transforms__log.png')
```
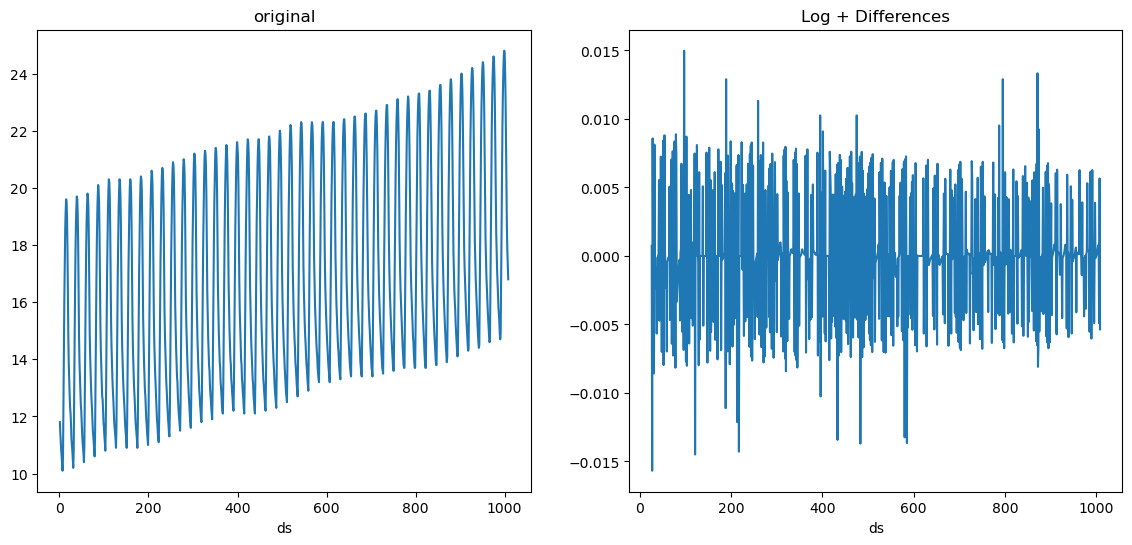
 We can also combine this with local transformations. For example we can
apply log first and then differencing.
```python theme={null}
fcst = MLForecast(
models=[],
freq=1,
target_transforms=[GlobalSklearnTransformer(sk_log1p), Differences([1, 24])],
)
log_diffs = fcst.preprocess(serie)
plot({'original': serie, 'Log + Differences': log_diffs}, 'target_transforms__log_diffs.png')
```
We can also combine this with local transformations. For example we can
apply log first and then differencing.
```python theme={null}
fcst = MLForecast(
models=[],
freq=1,
target_transforms=[GlobalSklearnTransformer(sk_log1p), Differences([1, 24])],
)
log_diffs = fcst.preprocess(serie)
plot({'original': serie, 'Log + Differences': log_diffs}, 'target_transforms__log_diffs.png')
```
 ## Custom transformations
> Implementing your own target transformations
In order to implement your own target transformation you have to define
a class that inherits from
`mlforecast.target_transforms.BaseTargetTransform` (this takes care of
setting the column names as the `id_col`, `time_col` and `target_col`
attributes) and implement the `fit_transform` and `inverse_transform`
methods. Here’s an example on how to define a min-max scaler.
```python theme={null}
from mlforecast.target_transforms import BaseTargetTransform
```
```python theme={null}
class LocalMinMaxScaler(BaseTargetTransform):
"""Scales each series to be in the [0, 1] interval."""
def fit_transform(self, df: pd.DataFrame) -> pd.DataFrame:
self.stats_ = df.groupby(self.id_col)[self.target_col].agg(['min', 'max'])
df = df.merge(self.stats_, on=self.id_col)
df[self.target_col] = (df[self.target_col] - df['min']) / (df['max'] - df['min'])
df = df.drop(columns=['min', 'max'])
return df
def inverse_transform(self, df: pd.DataFrame) -> pd.DataFrame:
df = df.merge(self.stats_, on=self.id_col)
for col in df.columns.drop([self.id_col, self.time_col, 'min', 'max']):
df[col] = df[col] * (df['max'] - df['min']) + df['min']
df = df.drop(columns=['min', 'max'])
return df
```
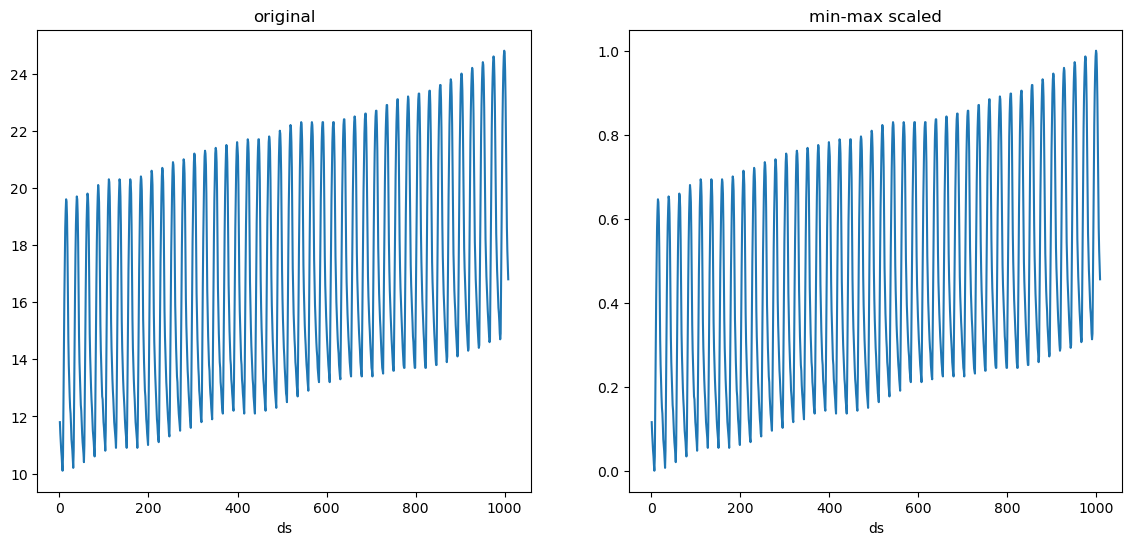
And now you can pass an instance of this class to the
`target_transforms` argument.
```python theme={null}
fcst = MLForecast(
models=[],
freq=1,
target_transforms=[LocalMinMaxScaler()],
)
minmax_scaled = fcst.preprocess(serie)
plot({'original': serie, 'min-max scaled': minmax_scaled}, 'target_transforms__minmax.png')
```
## Custom transformations
> Implementing your own target transformations
In order to implement your own target transformation you have to define
a class that inherits from
`mlforecast.target_transforms.BaseTargetTransform` (this takes care of
setting the column names as the `id_col`, `time_col` and `target_col`
attributes) and implement the `fit_transform` and `inverse_transform`
methods. Here’s an example on how to define a min-max scaler.
```python theme={null}
from mlforecast.target_transforms import BaseTargetTransform
```
```python theme={null}
class LocalMinMaxScaler(BaseTargetTransform):
"""Scales each series to be in the [0, 1] interval."""
def fit_transform(self, df: pd.DataFrame) -> pd.DataFrame:
self.stats_ = df.groupby(self.id_col)[self.target_col].agg(['min', 'max'])
df = df.merge(self.stats_, on=self.id_col)
df[self.target_col] = (df[self.target_col] - df['min']) / (df['max'] - df['min'])
df = df.drop(columns=['min', 'max'])
return df
def inverse_transform(self, df: pd.DataFrame) -> pd.DataFrame:
df = df.merge(self.stats_, on=self.id_col)
for col in df.columns.drop([self.id_col, self.time_col, 'min', 'max']):
df[col] = df[col] * (df['max'] - df['min']) + df['min']
df = df.drop(columns=['min', 'max'])
return df
```
And now you can pass an instance of this class to the
`target_transforms` argument.
```python theme={null}
fcst = MLForecast(
models=[],
freq=1,
target_transforms=[LocalMinMaxScaler()],
)
minmax_scaled = fcst.preprocess(serie)
plot({'original': serie, 'min-max scaled': minmax_scaled}, 'target_transforms__minmax.png')
```